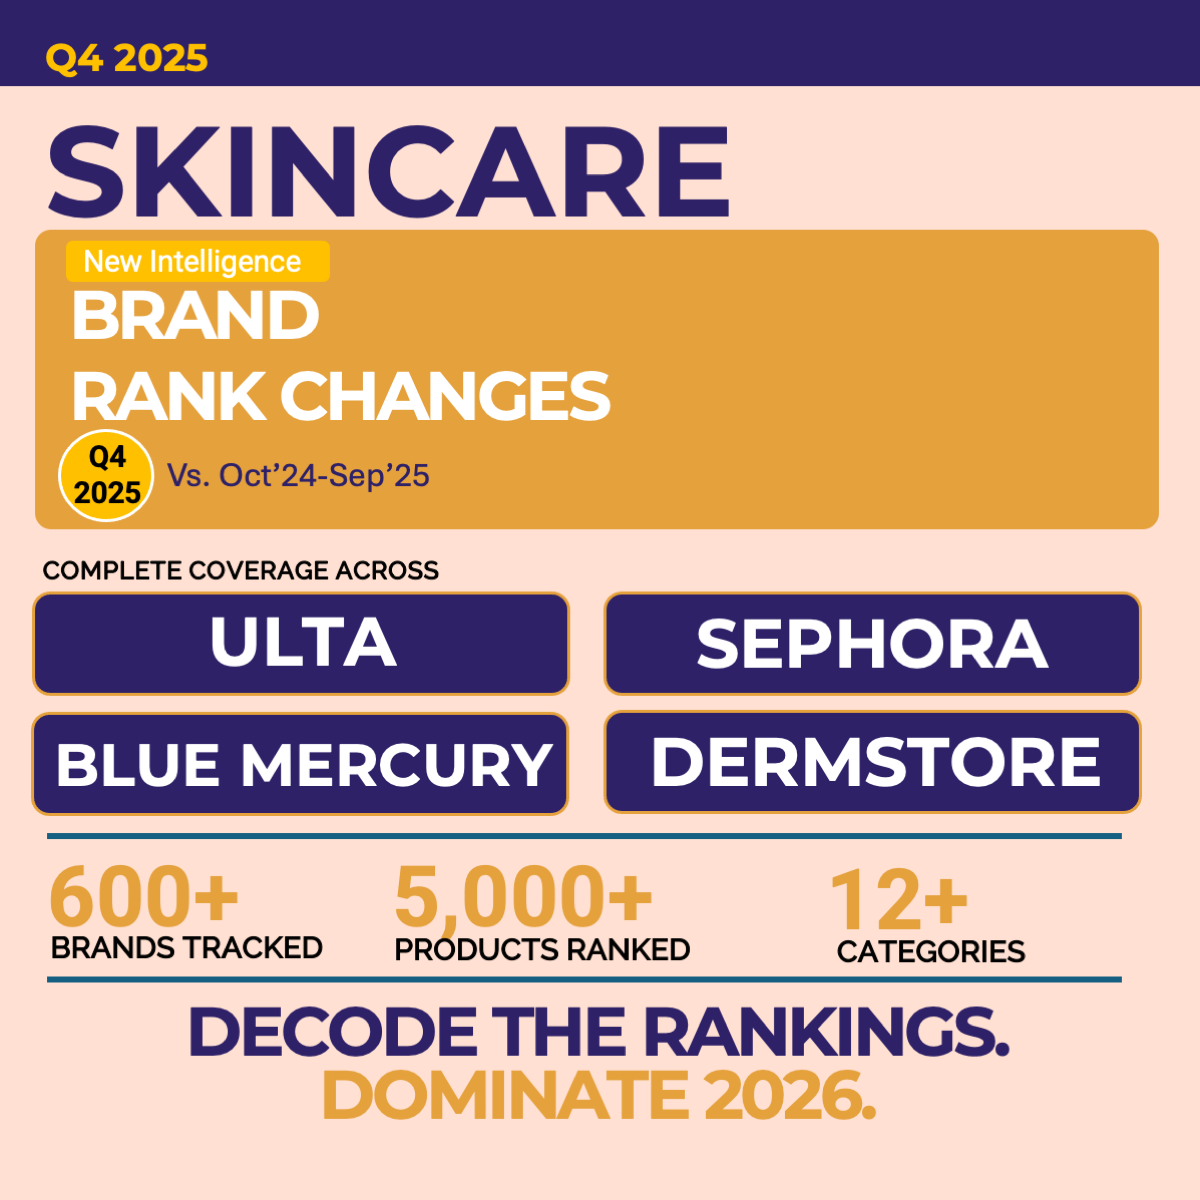

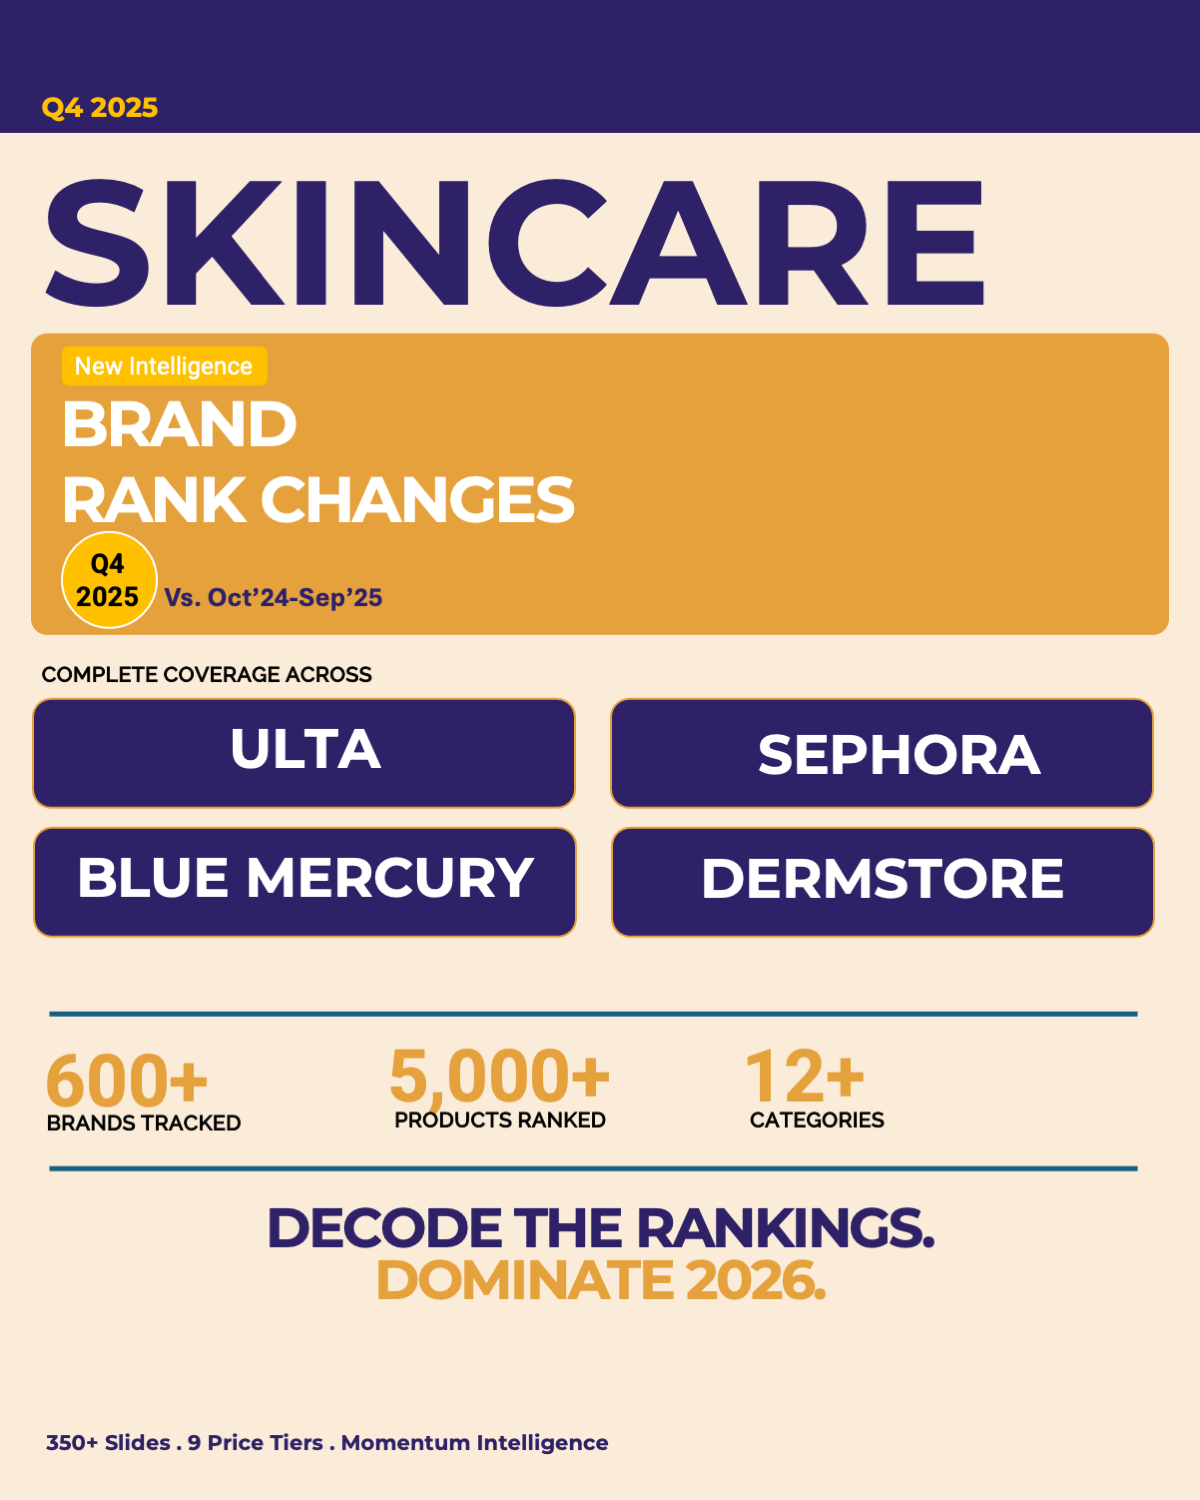
Q4 2025 Skincare Report: Ulta + Sephora + Blue Mercury + Dermstore Brand Ranks vs. Oct’24-Sep’25
$399.00
DECODE THE RANKINGS. DOMINATE YOUR CATEGORY. WIN 2026.
Actionable intelligence for brands at every stage of retail growth
Who is it for?
Beauty brand founders, CMOs, Investors, Brand, Category & Shopper Marketers, Consultants & Product Developers
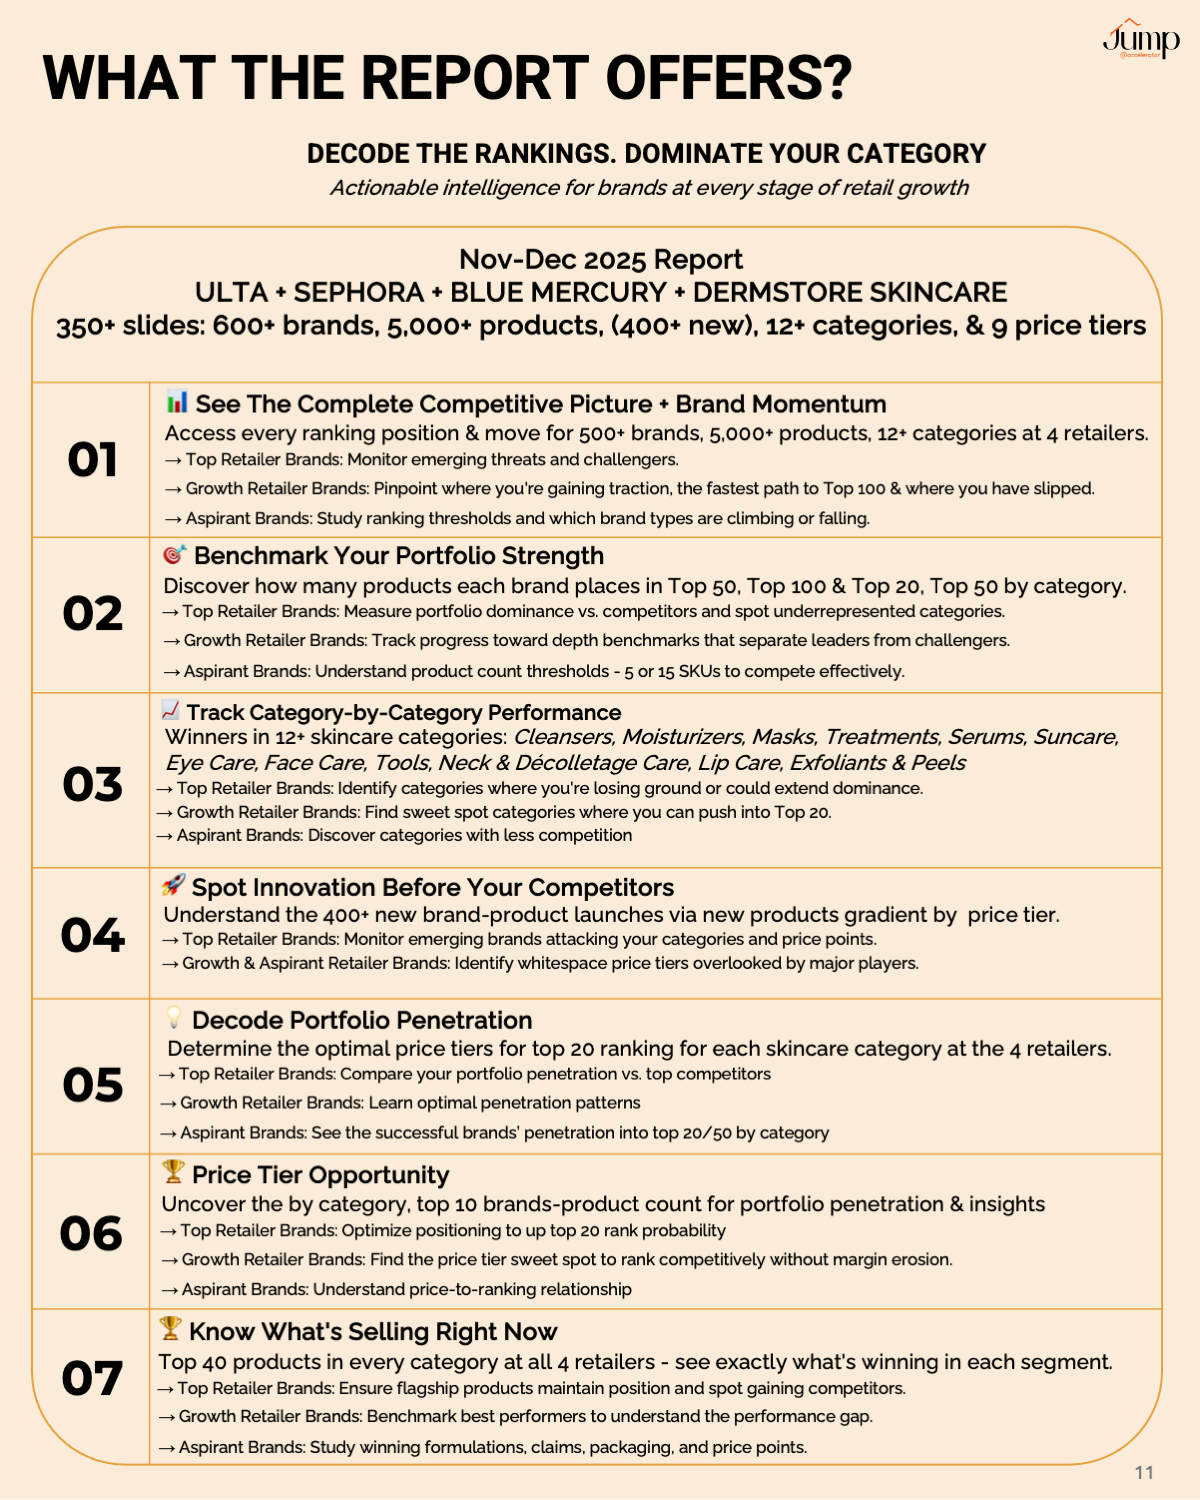
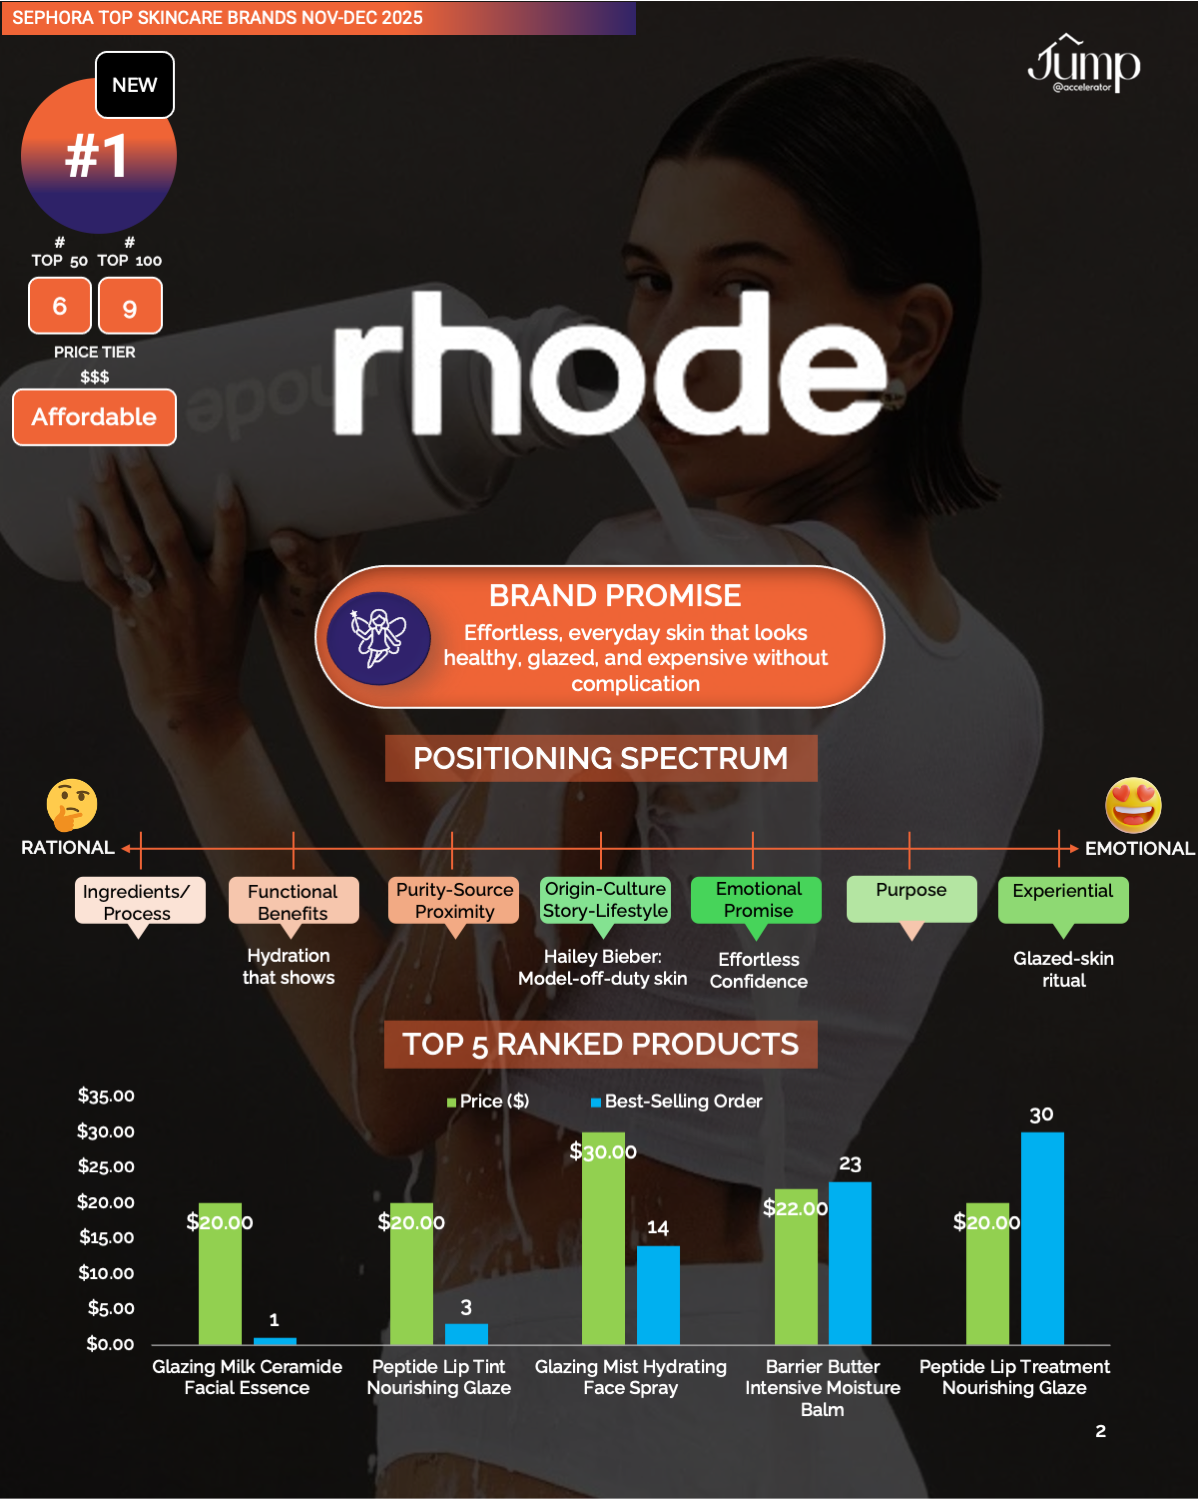
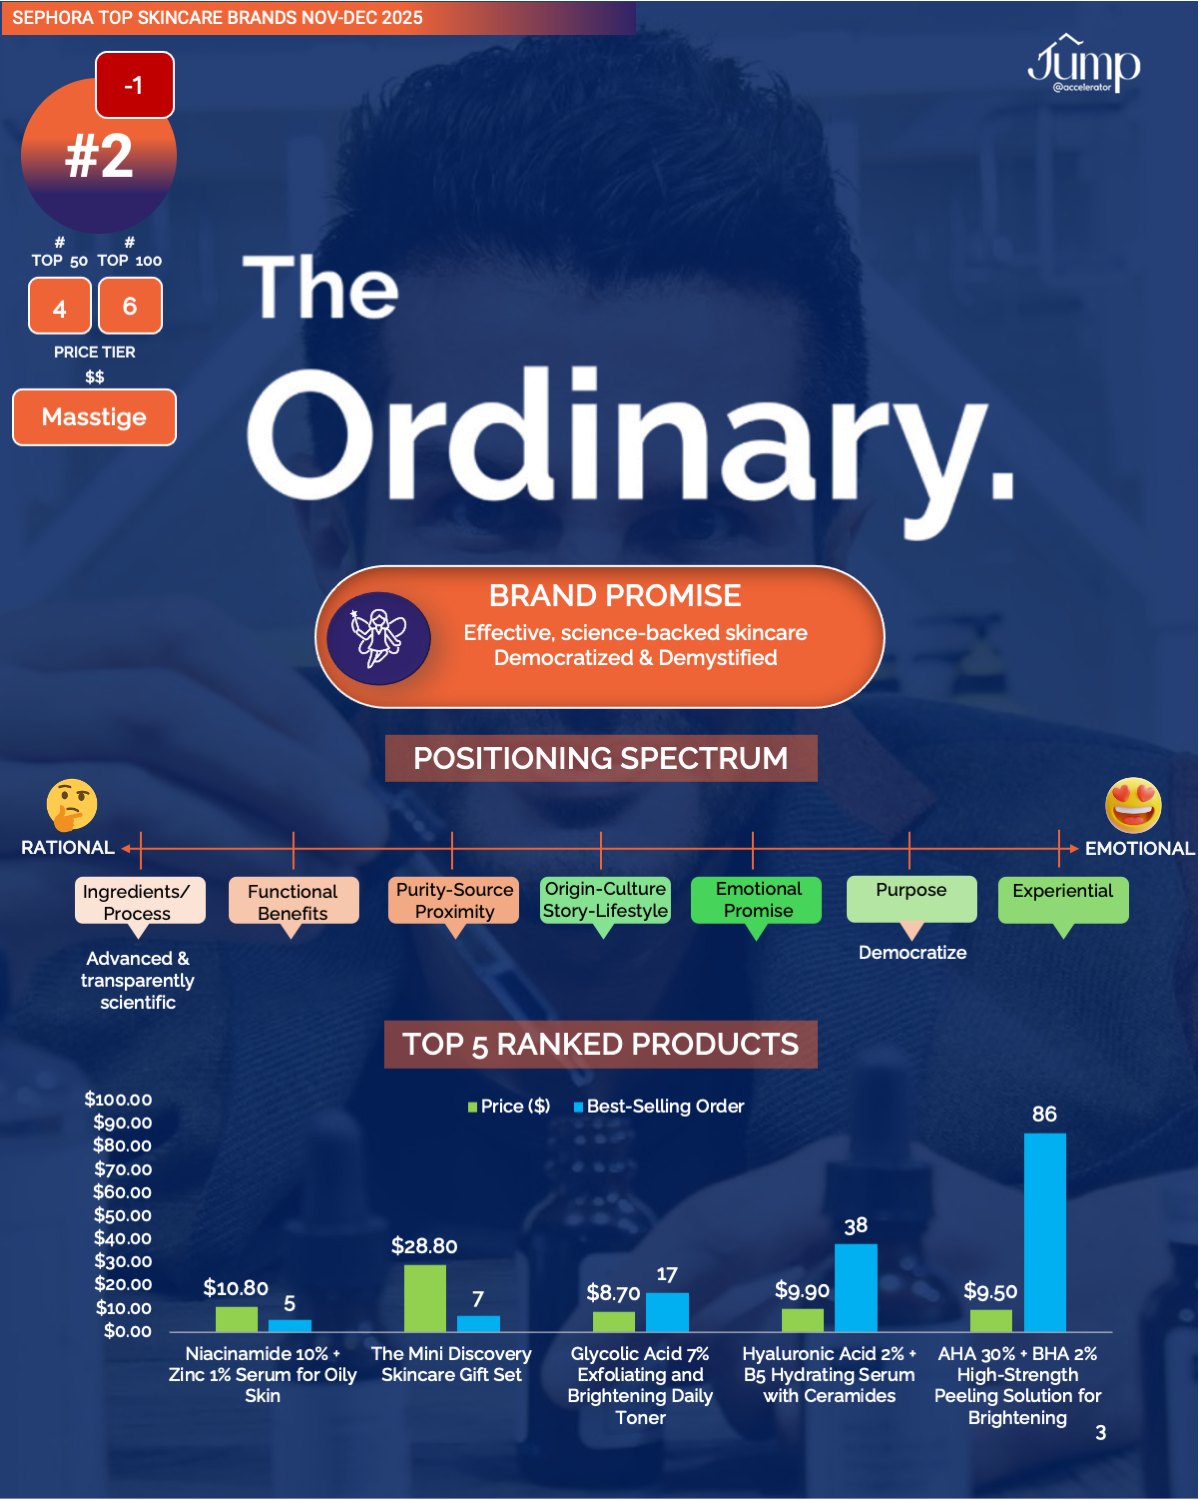
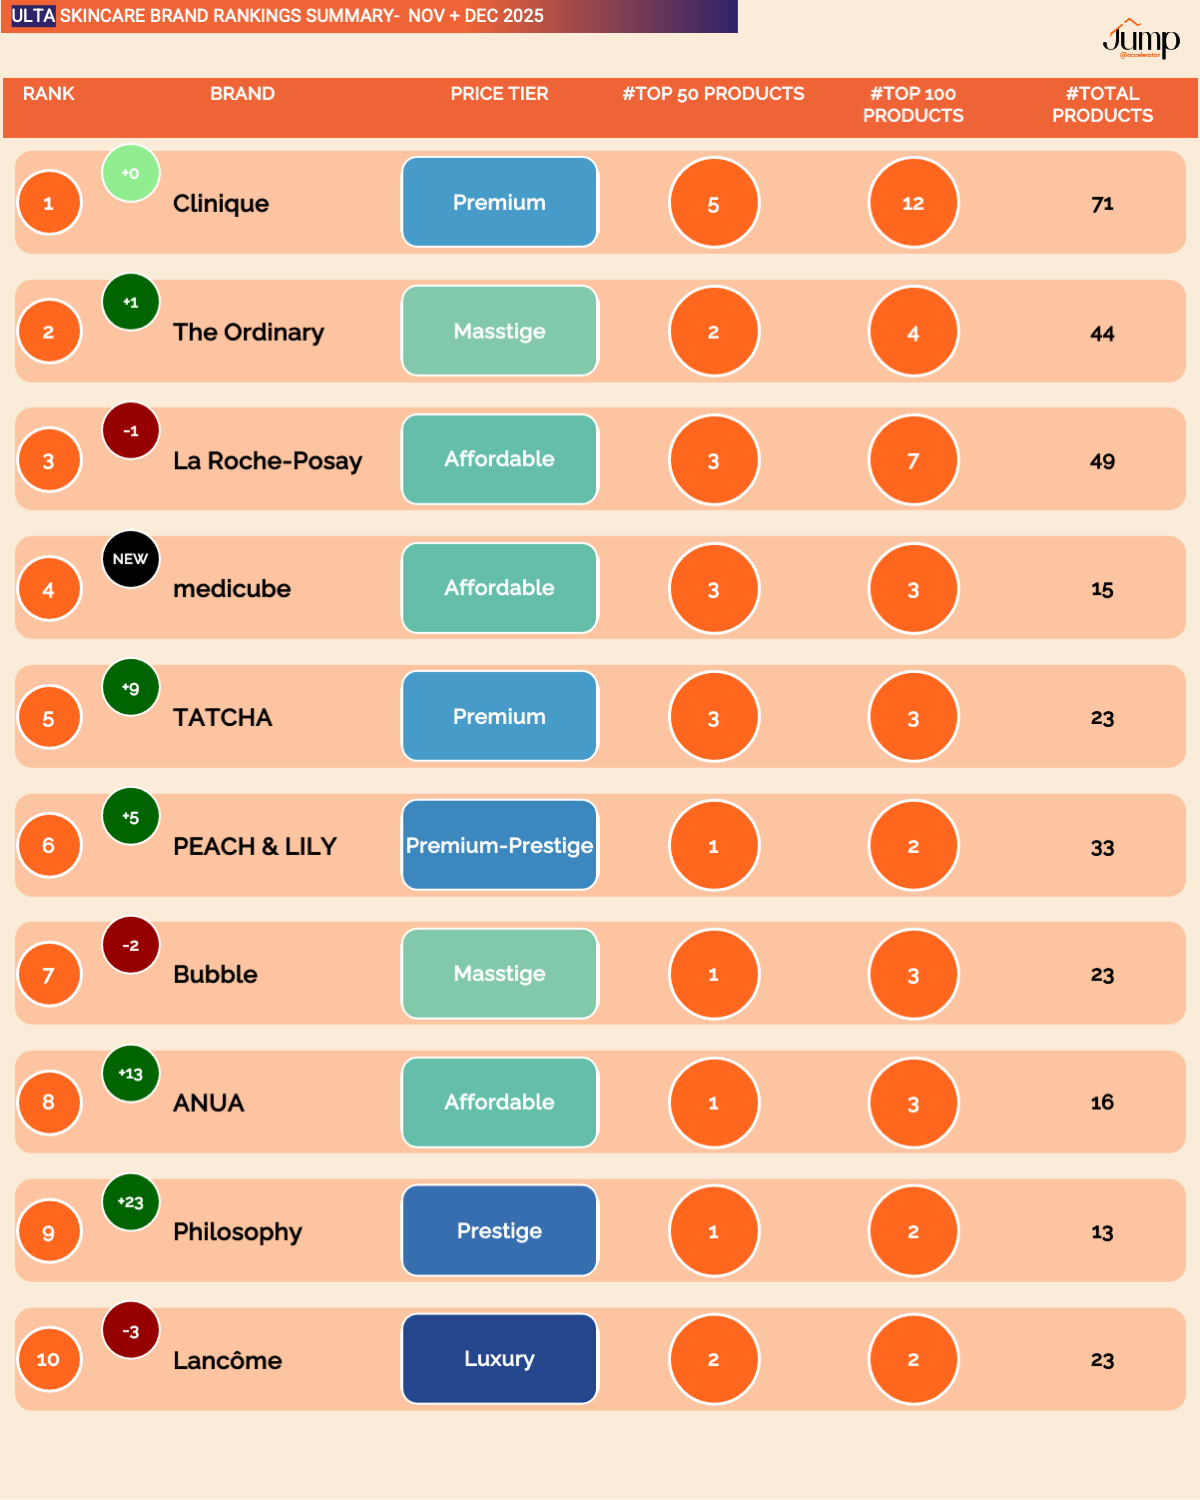
The report covers for Q4 2025 for ULTA + SEPHORA + BLUE MERCURY + DERMSTORE SKINCARE in 350+ slides for 600+ brands, 5,000+ products, 12+ categories, & 9 price tiers
📊 See The Complete Competitive Picture + Brand Momentum
Access every ranking position & move for 600+ brands, 5,000+ products, 12+ categories at 4 retailers.
→ Top Retailer Brands: Defend your position by monitoring emerging threats and identifying categories where challengers are gaining ground.
→ Growth Retailer Brands: Pinpoint where you’re gaining traction, the fastest path to Top 100 & where you have slipped.
→ Aspirant Brands: Study ranking thresholds and which brand types are climbing or falling.
🎯 Benchmark Your Portfolio Strength
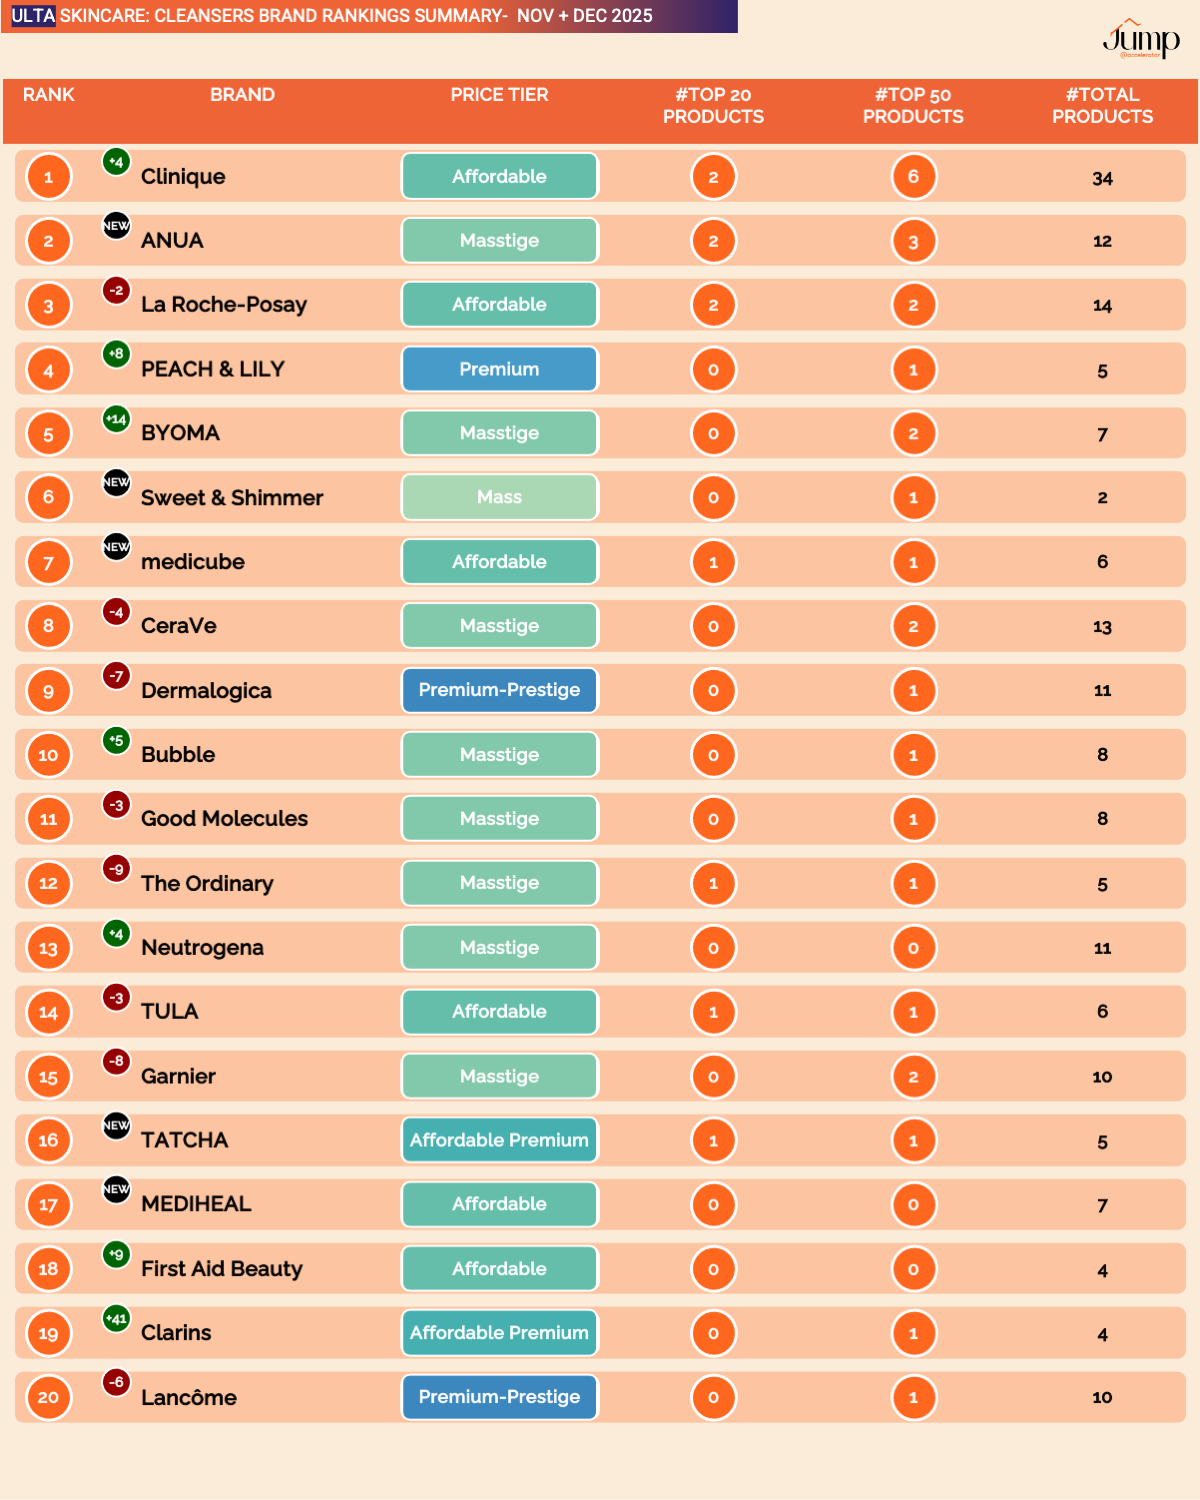
Discover how many products each brand places in Top 50, Top 100 overall, and Top 20, Top 50 by category.
→ Top Retailer Brands: Measure your portfolio dominance vs. direct competitors and identify categories where you’re underrepresented despite brand strength.
→ Growth Retailer Brands: Track your progress toward portfolio depth benchmarks that separate category leaders from challengers.
→ Aspirant Brands: Understand the product count thresholds leaders maintain, know whether you need 5 or 15 SKUs to compete effectively.
📈 Track Category-by-Category Performance
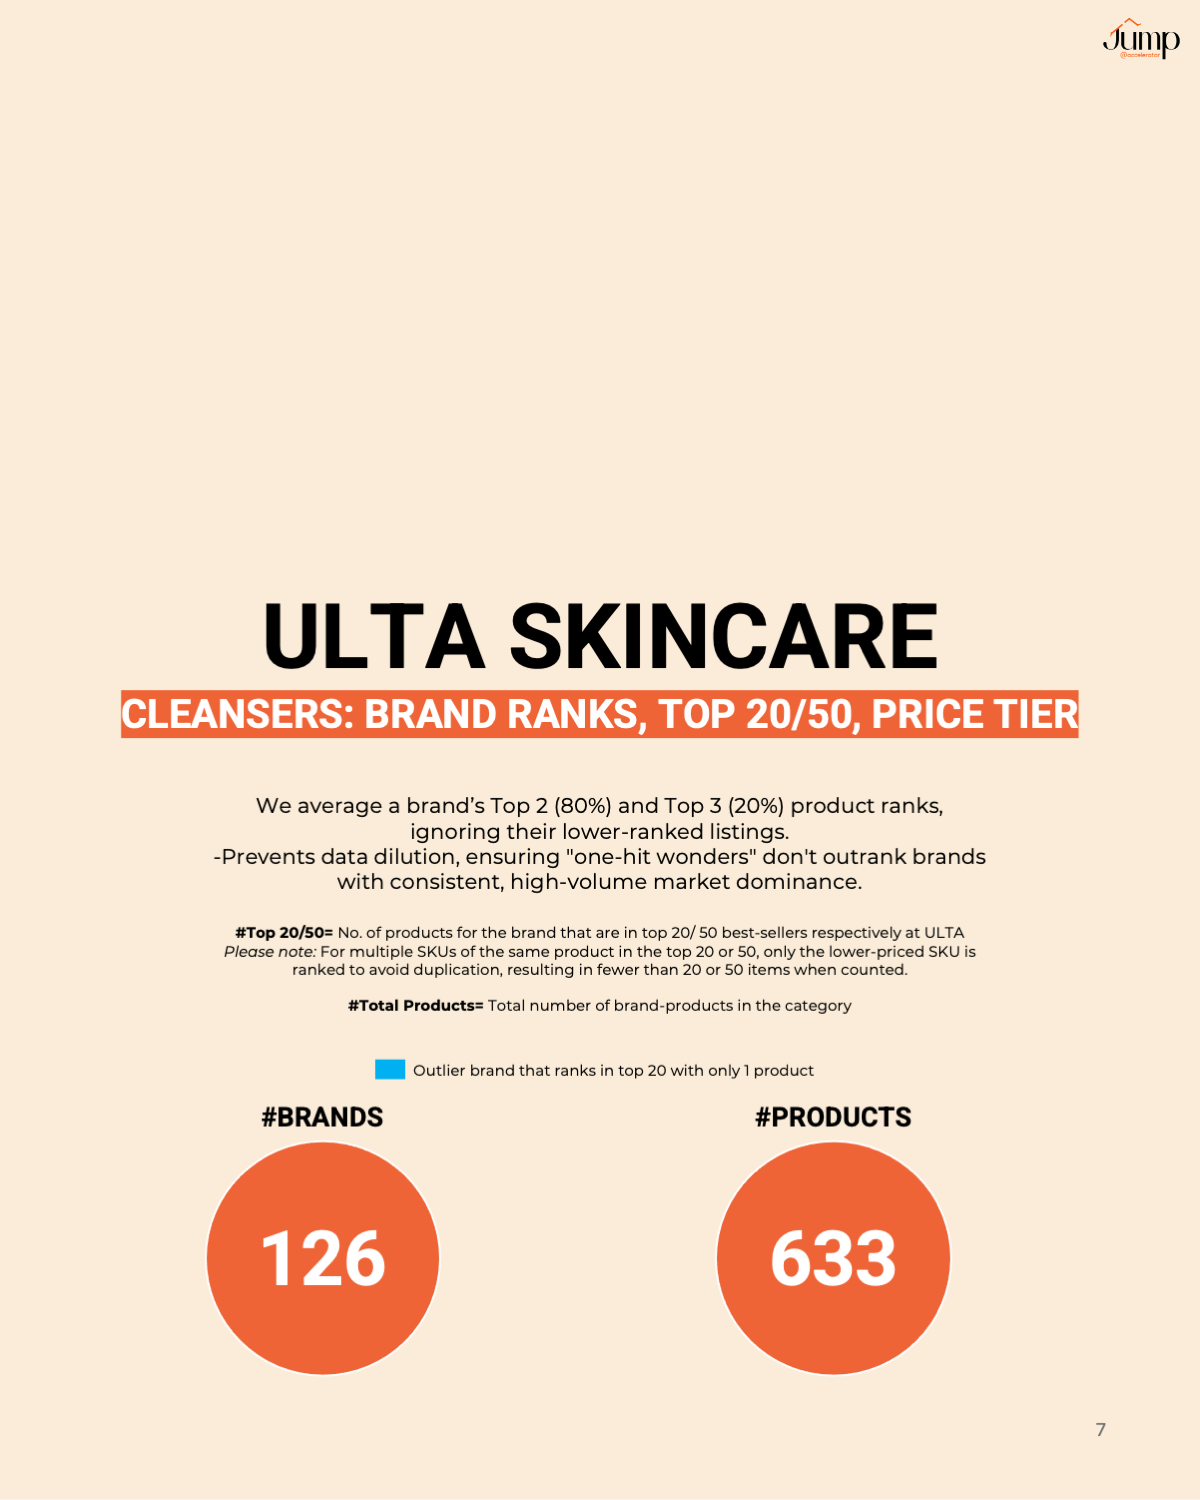
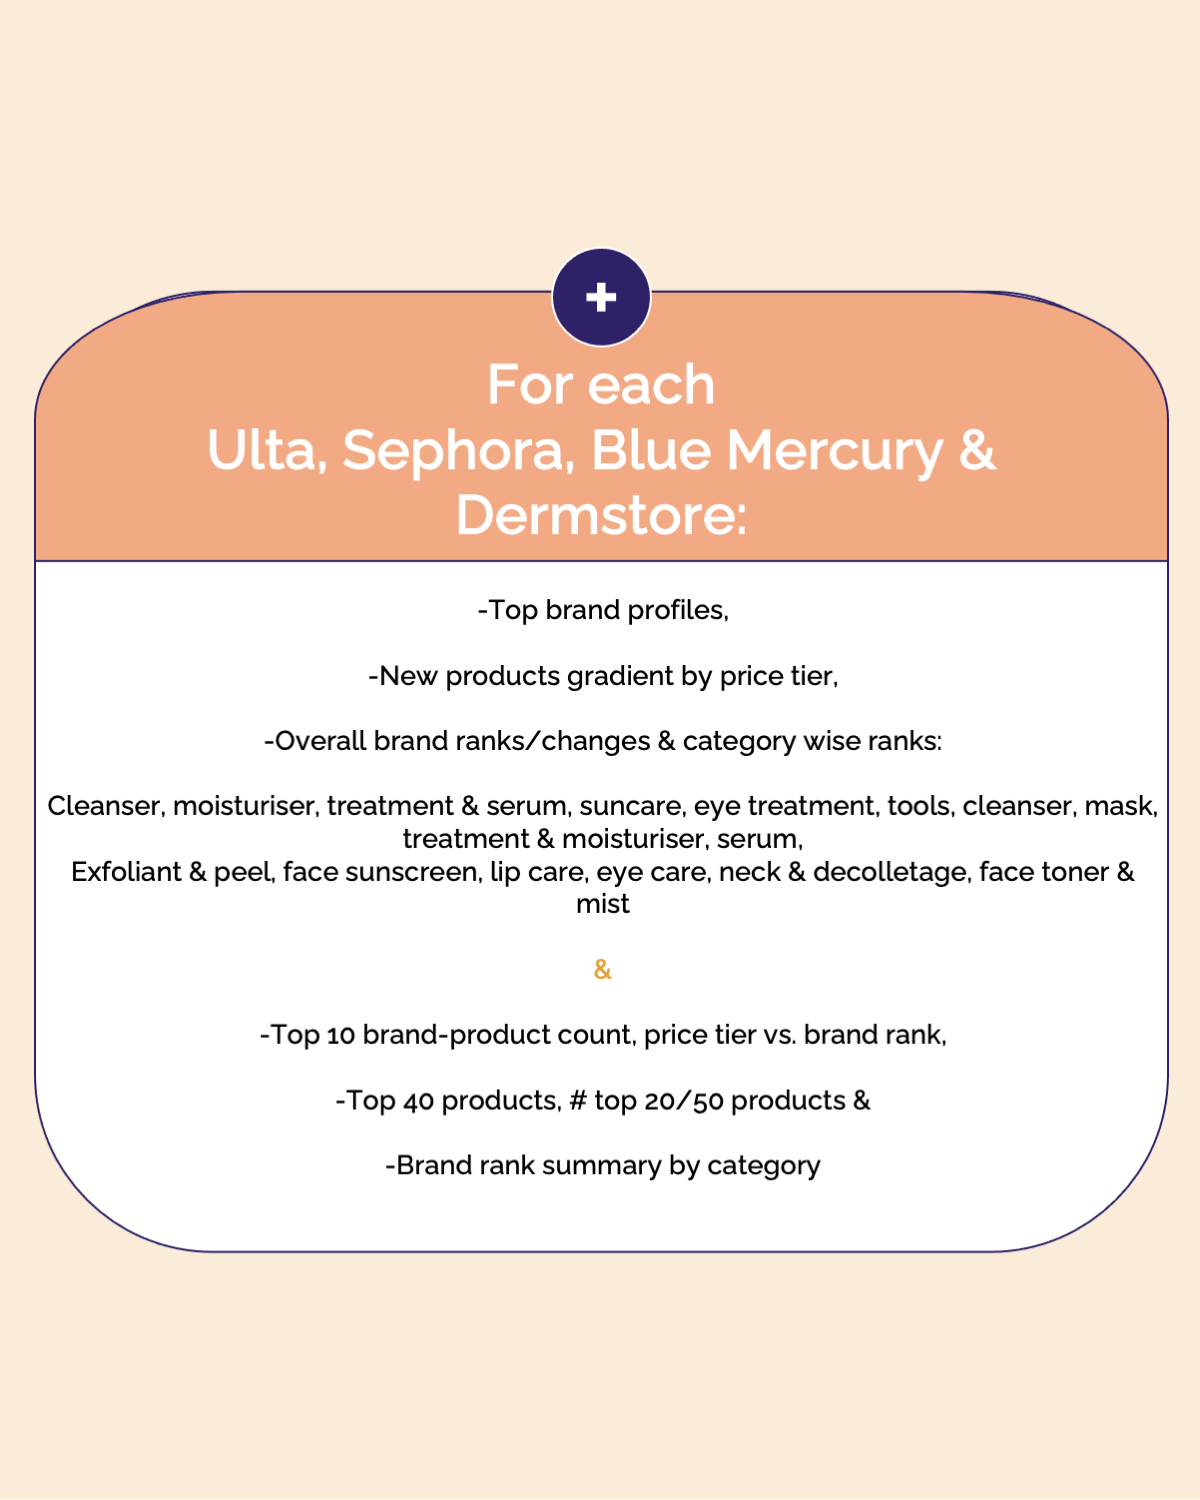
Rankings across 12+ skincare segments—Cleansers, Moisturizers, Serums, Treatments, Suncare, Eye Care, Masks, Face Care, Tools, Neck & Décolletage, Lip Care, Exfoliants & Peels.
→ Top Retailer Brands: Identify categories where you’re losing ground to challengers and where you could extend dominance with strategic launches.
→ Growth Retailer Brands: Find your sweet spot categories where you’re already ranking well and can push into Top 20 with focused effort.
→ Aspirant Brands: Discover which categories have less entrenched competition and lower barriers to entry for your first listings.
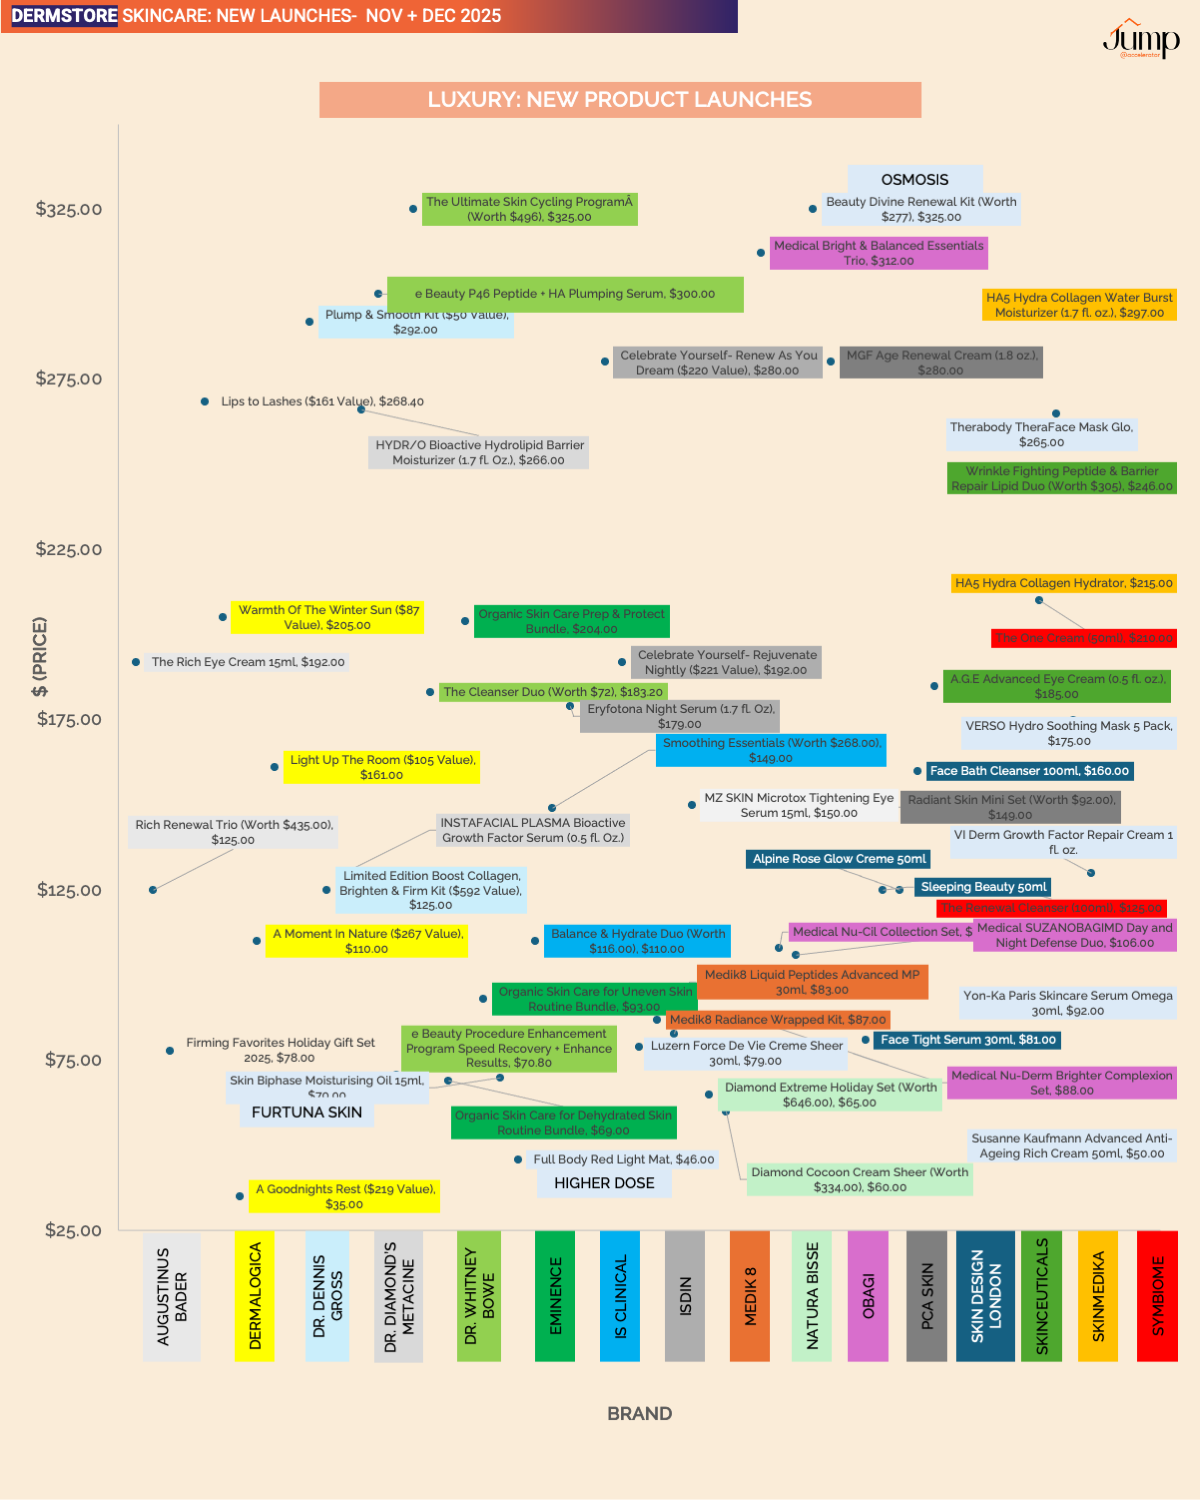
🚀 Spot Innovation Before Your Competitors
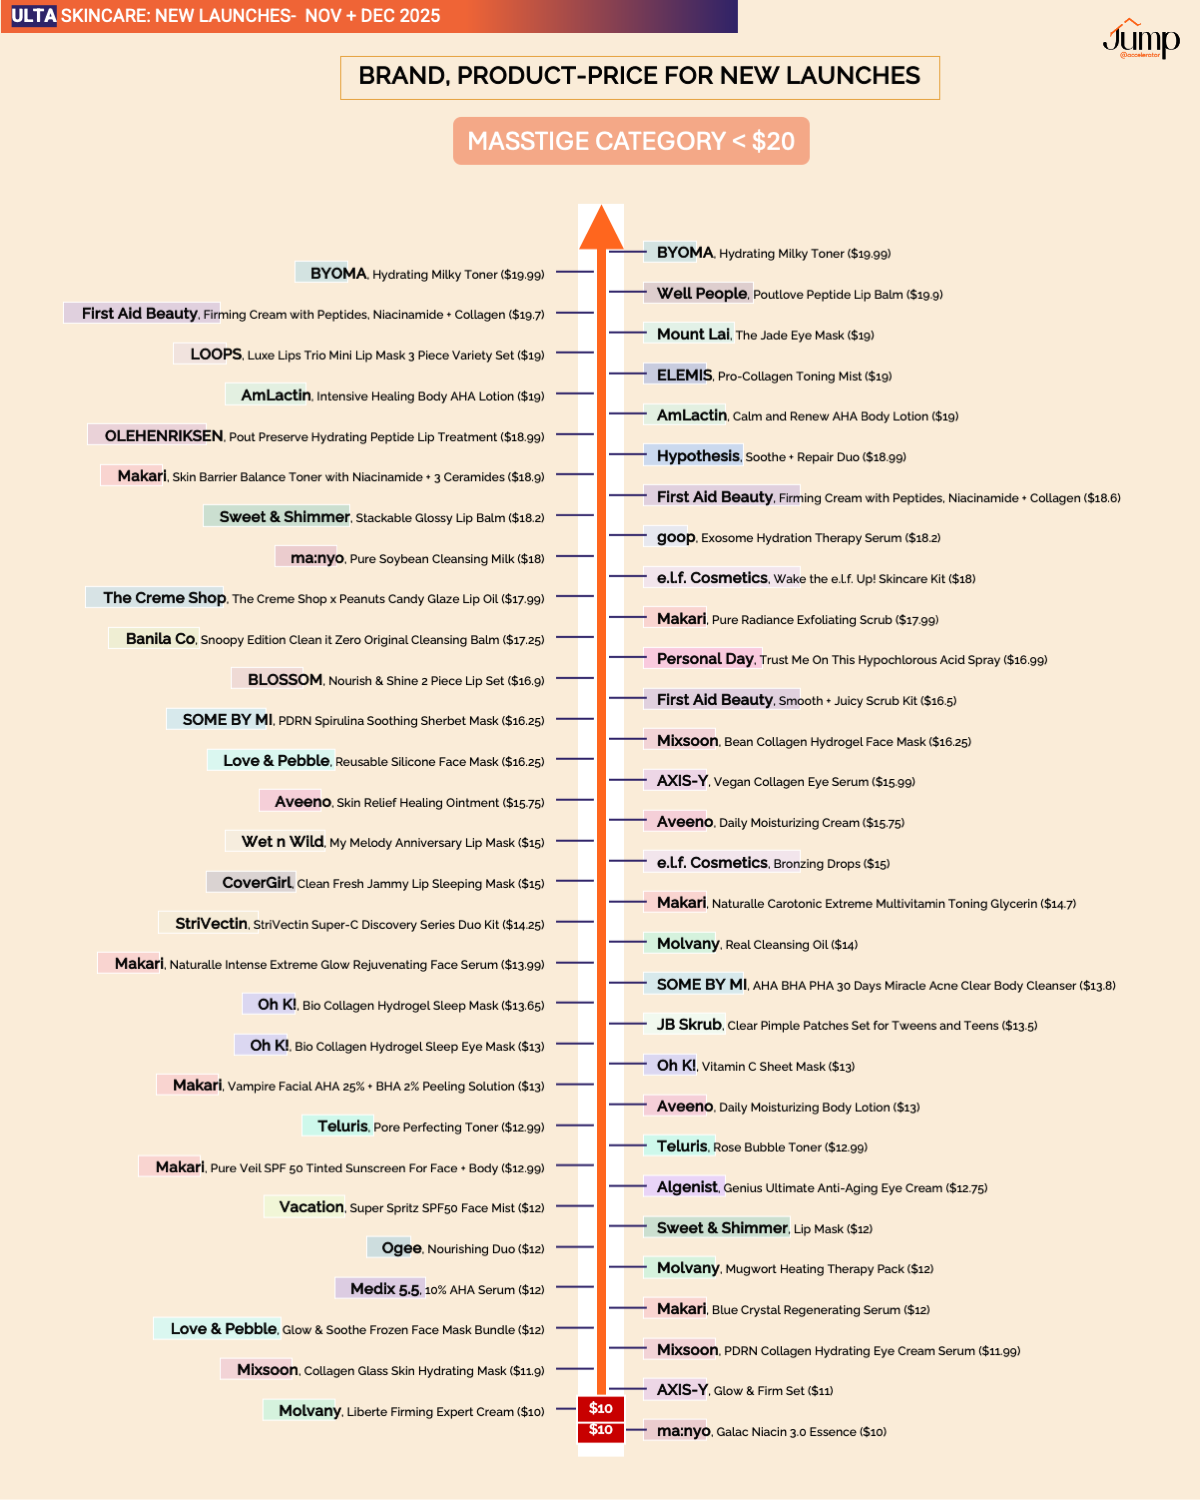
400+ new product launches analyzed by price tier with visual patterns revealing where innovation is happening and at what price points.
→ Top Retailer Brands: Monitor which emerging brands are launching in your categories and at what price points they’re attacking your position.
→ Growth Retailer Brands: See where innovation is concentrating and identify whitespace price tiers being overlooked by major players.
→ Aspirant Brands: Study successful recent launches to understand pricing strategies, category choices, and timing that led to retail placement.
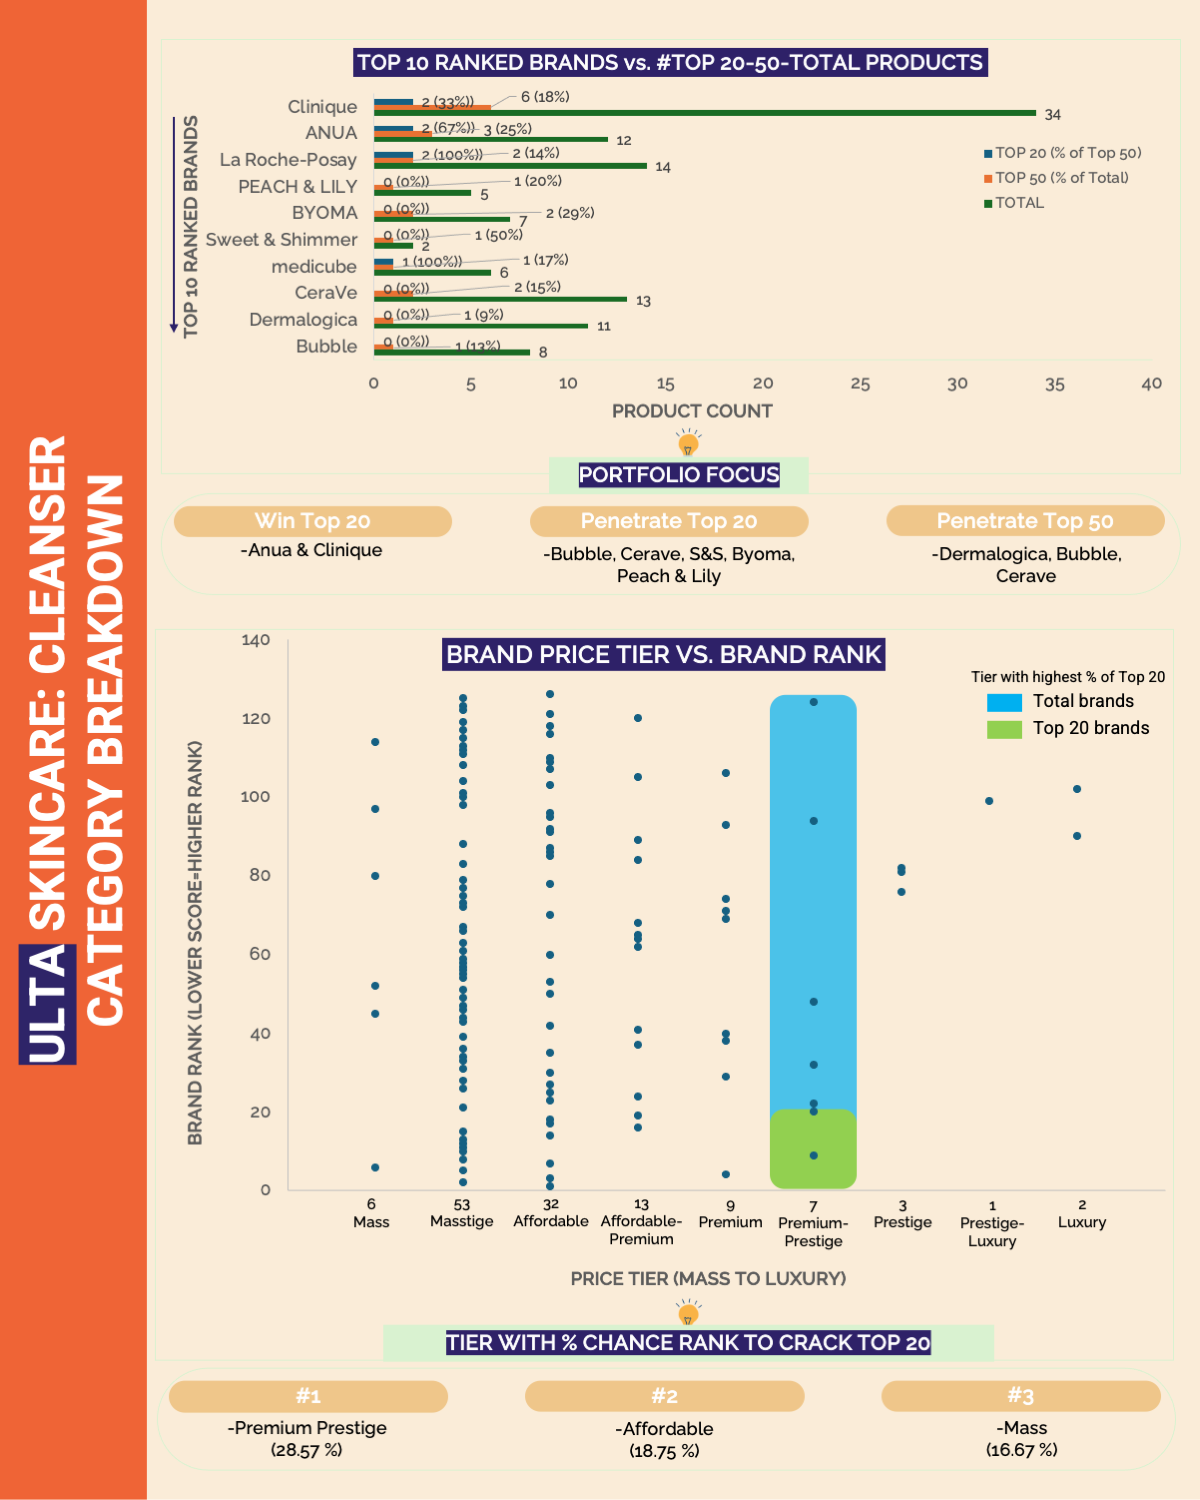
💡 Decode Portfolio Penetration
Top 10 brand-product counts plotted and analyzed by category, revealing how market leaders achieve depth, breadth, and sustained ranking presence.
→ Top Retailer Brands: Validate your SKU expansion and rationalization strategies by comparing your portfolio penetration against top competitors across all categories – identify where you’re overextended or underrepresented.
→ Growth Retailer Brands: Learn the optimal portfolio penetration pattern – understand how many products leaders maintain in each category and which categories deserve deeper investment vs. single hero product representation.
→ Aspirant Brands: Decode whether successful brands entered with focused single-category depth or diversified breadth – see the exact product count strategy that correlates with Top 100 breakthrough.
💰 Price With Data-Driven Precision
Visual price-rank analysis reveals which price tiers consistently deliver Top 20 rankings in each category.
→ Top Retailer Brands: Optimize your premium positioning or identify opportunities to capture mid-tier share without diluting brand equity.
→ Growth Retailer Brands: Find the price tier sweet spot where you can rank competitively without racing to the bottom on margin.
→ Aspirant Brands: Understand the price-to-ranking relationship before you set your pricing strategy – avoid the pricing traps that keep brands out of top tiers.
🏆 Know What’s Selling Right Now
Top 40 products in every category at all 4 retailers – see exactly what’s winning in each segment.
→ Top Retailer Brands: Ensure your flagship products maintain their positions and identify which competitor products are gaining on you.
→ Growth Retailer Brands: Benchmark your best performers against category winners to understand the performance gap you need to close.
→ Aspirant Brands: Study exactly what’s working in your target categories – formulations, claims, packaging, price points that consistently rank.
How do We Collect Data?
Our Market Dominance Index methodology prevents data distortion by weighting sustained performance over viral moments.
Stop making category decisions based on gut instinct and incomplete data. Start dominating with the complete competitive picture – current through Q4 2025 – your rivals wish they had.
(Save thousands(>$5K) of dollars in consulting & hundreds of hours in research & analysis)
750+ Beauty Professionals trust Jump Reports!
Access Q4 2025 Skincare Intelligence Now!


Preview
Preview
Preview
Preview
Preview
Description
DECODE THE RANKINGS. DOMINATE YOUR CATEGORY. WIN 2026.
Actionable intelligence for brands at every stage of retail growth
Who is it for?
Beauty brand founders, CMOs, Investors, Brand, Category & Shopper Marketers, Consultants & Product Developers
The report covers for Q4 2025 for ULTA + SEPHORA + BLUE MERCURY + DERMSTORE SKINCARE in 350+ slides for 600+ brands, 5,000+ products, 12+ categories, & 9 price tiers
📊 See The Complete Competitive Picture + Brand Momentum
Access every ranking position & move for 600+ brands, 5,000+ products, 12+ categories at 4 retailers.
→ Top Retailer Brands: Defend your position by monitoring emerging threats and identifying categories where challengers are gaining ground.
→ Growth Retailer Brands: Pinpoint where you’re gaining traction, the fastest path to Top 100 & where you have slipped.
→ Aspirant Brands: Study ranking thresholds and which brand types are climbing or falling.
🎯 Benchmark Your Portfolio Strength
Discover how many products each brand places in Top 50, Top 100 overall, and Top 20, Top 50 by category.
→ Top Retailer Brands: Measure your portfolio dominance vs. direct competitors and identify categories where you’re underrepresented despite brand strength.
→ Growth Retailer Brands: Track your progress toward portfolio depth benchmarks that separate category leaders from challengers.
→ Aspirant Brands: Understand the product count thresholds leaders maintain, know whether you need 5 or 15 SKUs to compete effectively.
📈 Track Category-by-Category Performance
Rankings across 12+ skincare segments—Cleansers, Moisturizers, Serums, Treatments, Suncare, Eye Care, Masks, Face Care, Tools, Neck & Décolletage, Lip Care, Exfoliants & Peels.
→ Top Retailer Brands: Identify categories where you’re losing ground to challengers and where you could extend dominance with strategic launches.
→ Growth Retailer Brands: Find your sweet spot categories where you’re already ranking well and can push into Top 20 with focused effort.
→ Aspirant Brands: Discover which categories have less entrenched competition and lower barriers to entry for your first listings.
🚀 Spot Innovation Before Your Competitors
400+ new product launches analyzed by price tier with visual patterns revealing where innovation is happening and at what price points.
→ Top Retailer Brands: Monitor which emerging brands are launching in your categories and at what price points they’re attacking your position.
→ Growth Retailer Brands: See where innovation is concentrating and identify whitespace price tiers being overlooked by major players.
→ Aspirant Brands: Study successful recent launches to understand pricing strategies, category choices, and timing that led to retail placement.
💡 Decode Portfolio Penetration
Top 10 brand-product counts plotted and analyzed by category, revealing how market leaders achieve depth, breadth, and sustained ranking presence.
→ Top Retailer Brands: Validate your SKU expansion and rationalization strategies by comparing your portfolio penetration against top competitors across all categories – identify where you’re overextended or underrepresented.
→ Growth Retailer Brands: Learn the optimal portfolio penetration pattern – understand how many products leaders maintain in each category and which categories deserve deeper investment vs. single hero product representation.
→ Aspirant Brands: Decode whether successful brands entered with focused single-category depth or diversified breadth – see the exact product count strategy that correlates with Top 100 breakthrough.
💰 Price With Data-Driven Precision
Visual price-rank analysis reveals which price tiers consistently deliver Top 20 rankings in each category.
→ Top Retailer Brands: Optimize your premium positioning or identify opportunities to capture mid-tier share without diluting brand equity.
→ Growth Retailer Brands: Find the price tier sweet spot where you can rank competitively without racing to the bottom on margin.
→ Aspirant Brands: Understand the price-to-ranking relationship before you set your pricing strategy – avoid the pricing traps that keep brands out of top tiers.
🏆 Know What’s Selling Right Now
Top 40 products in every category at all 4 retailers – see exactly what’s winning in each segment.
→ Top Retailer Brands: Ensure your flagship products maintain their positions and identify which competitor products are gaining on you.
→ Growth Retailer Brands: Benchmark your best performers against category winners to understand the performance gap you need to close.
→ Aspirant Brands: Study exactly what’s working in your target categories – formulations, claims, packaging, price points that consistently rank.
How do We Collect Data?
Our Market Dominance Index methodology prevents data distortion by weighting sustained performance over viral moments.
Stop making category decisions based on gut instinct and incomplete data. Start dominating with the complete competitive picture – current through Q4 2025 – your rivals wish they had.
(Save thousands(>$5K) of dollars in consulting & hundreds of hours in research & analysis)
750+ Beauty Professionals trust Jump Reports!
Access Q4 2025 Skincare Intelligence Now!