



Suzanne LeRoux
Rohit,
This is incredibly useful work-especially the sections on top-ranking brands (and why), individual product rankings, category winners, and the white space vs. saturation analysis. That’s where it becomes most strategic for me. Some sections feel a little dense. Overall, the competitive visibility is excellent.”
Suzanne LeRoux
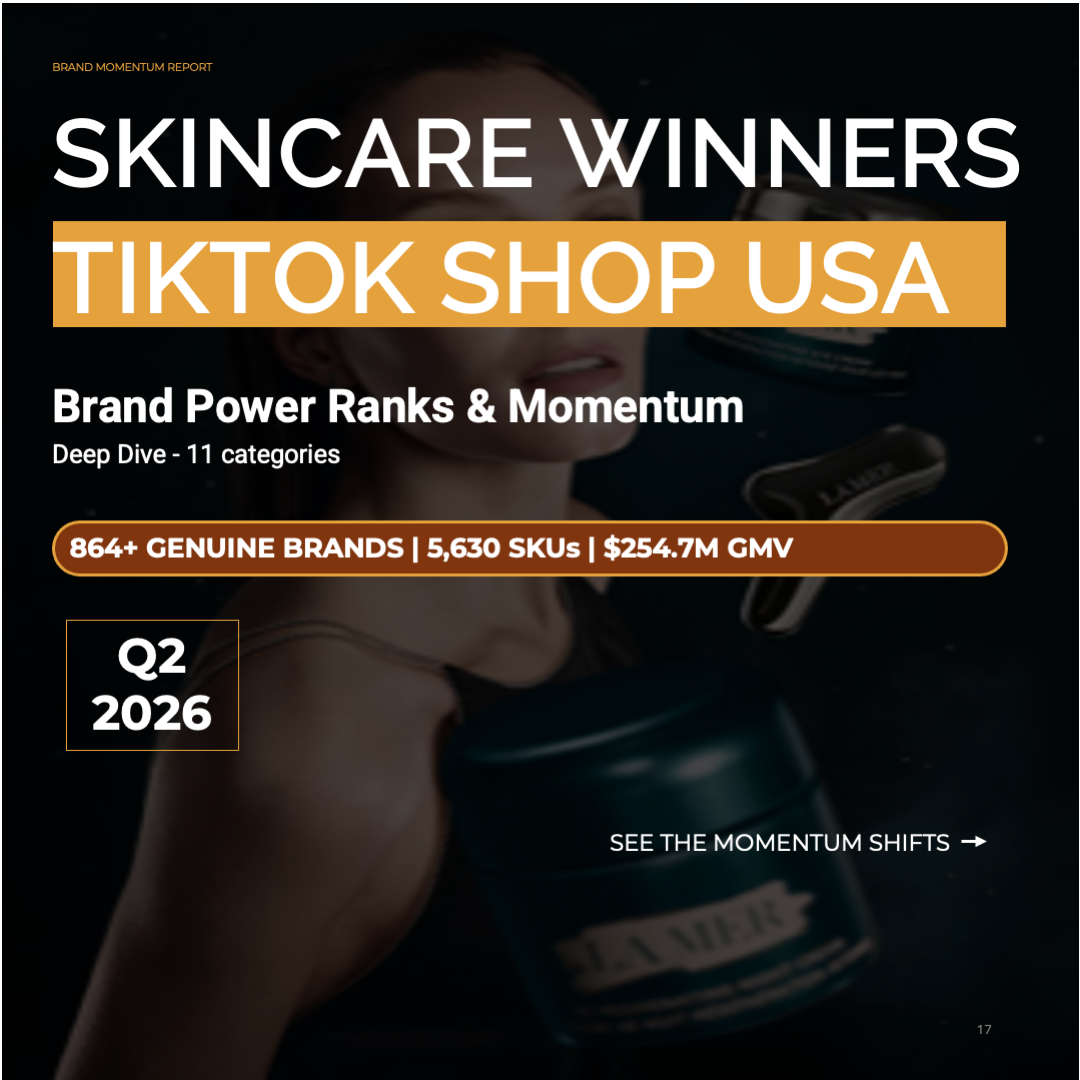
Q2 2026: TikTok Shop USA Skincare Intelligence Report
$399.00
SCROLL DOWN TO PREVIEW BELOW.
Stop Guessing. Start Winning.
EXECUTIVE SUMMARY
On TikTok Shop there is no buyer to convince and no shelf to win, so entry is free and almost nothing is scarce except durable velocity. Jump Accelerator’s new skincare report decodes the brands, products, categories and pricing shaping performance on TikTok Shop USA.
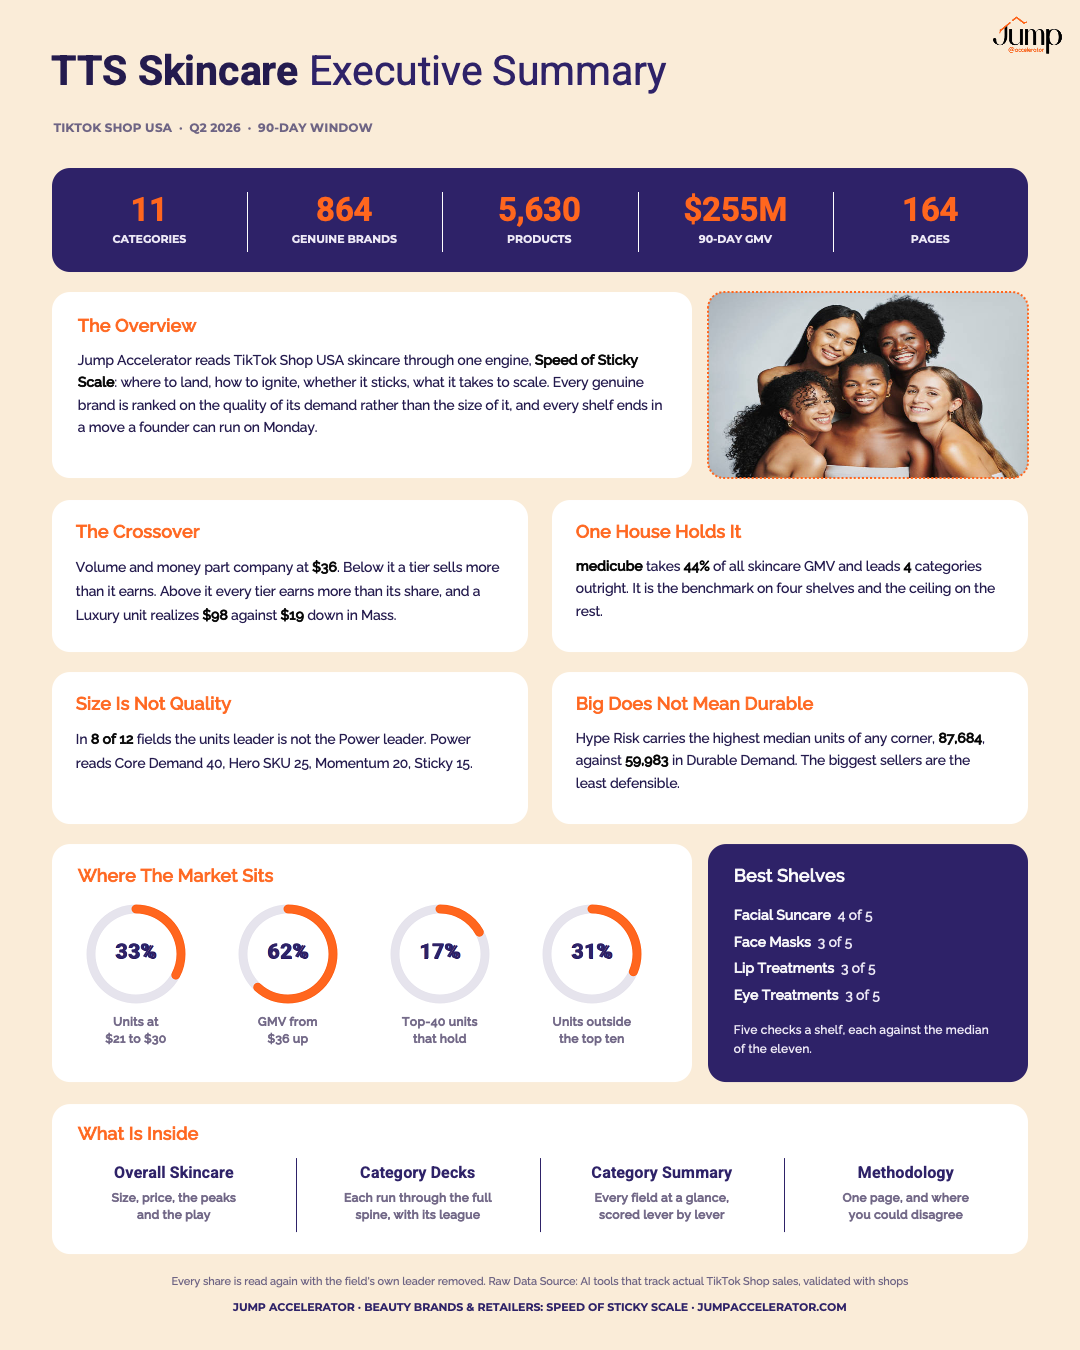
The field is cleaned first: resellers, white labels, retailers and gift-with-purchase listings are stripped before a single index runs. Every genuine brand then takes a Power Score weighting core demand, hero SKU strength, momentum and stickiness, and in eight of twelve fields the units leader is not the Power leader. The Momentum Index sorts brands into accelerators, bankers and fade candidates, and the Sticky Signal quadrant divides durable demand from hype. Price architecture removes each tier’s own leader and most tiers collapse: a third of everything sold still sits at $21 to $30, but 62% of the money is already above $36.
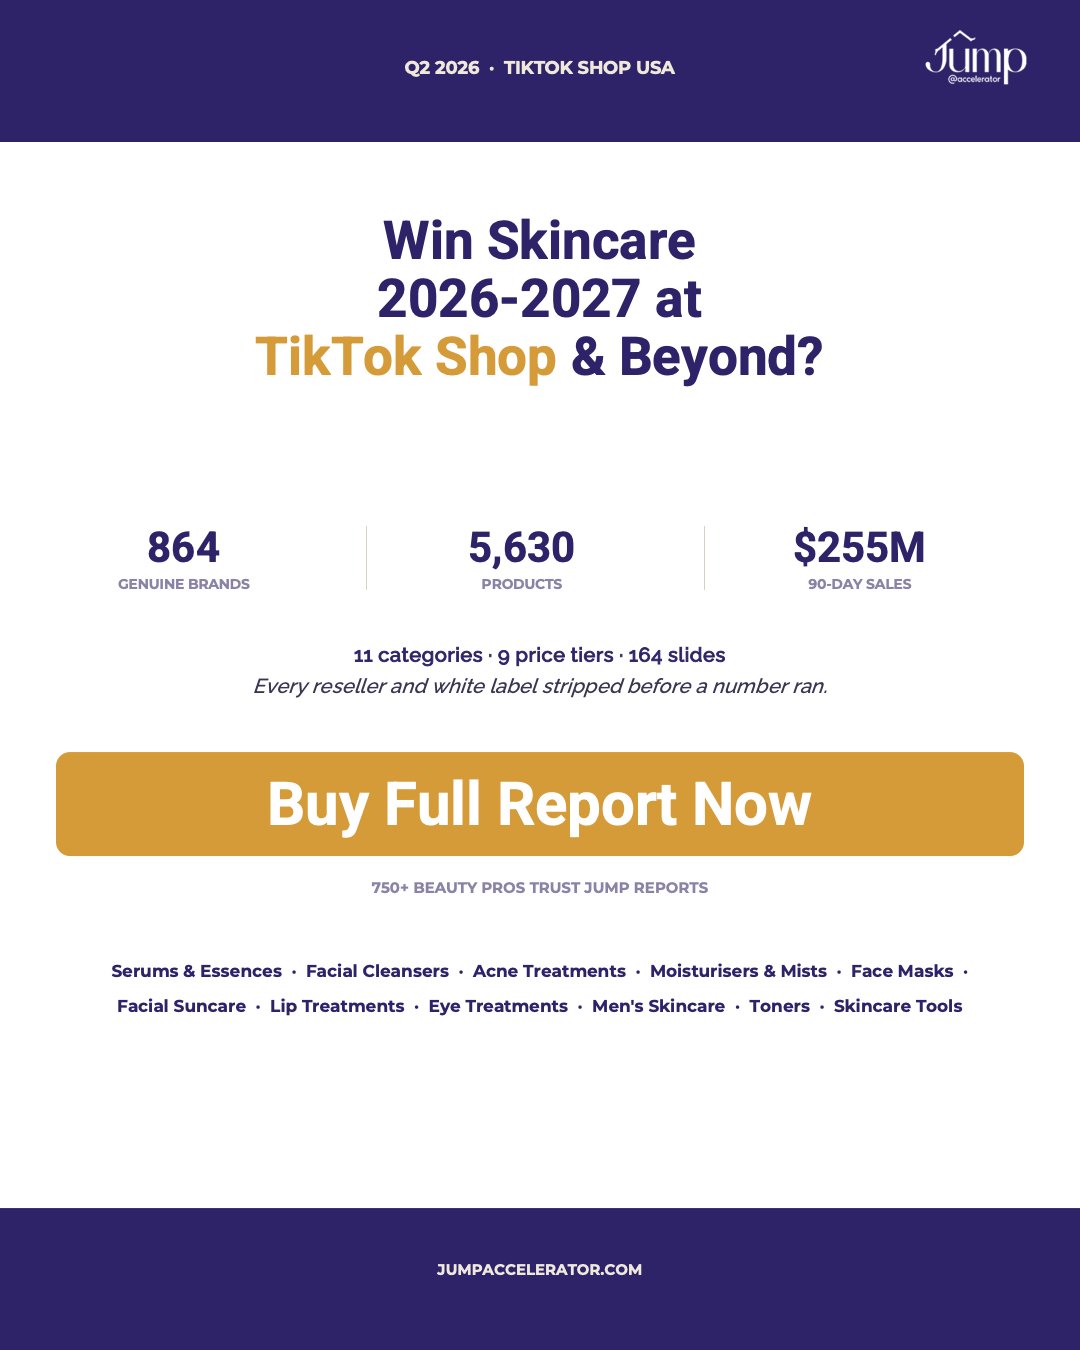
Built on actual TikTok Shop sales: 864 genuine brands · 5,630 products · $254.7M in 90-day sales · 11 categories · 9 price tiers · 164 slides.
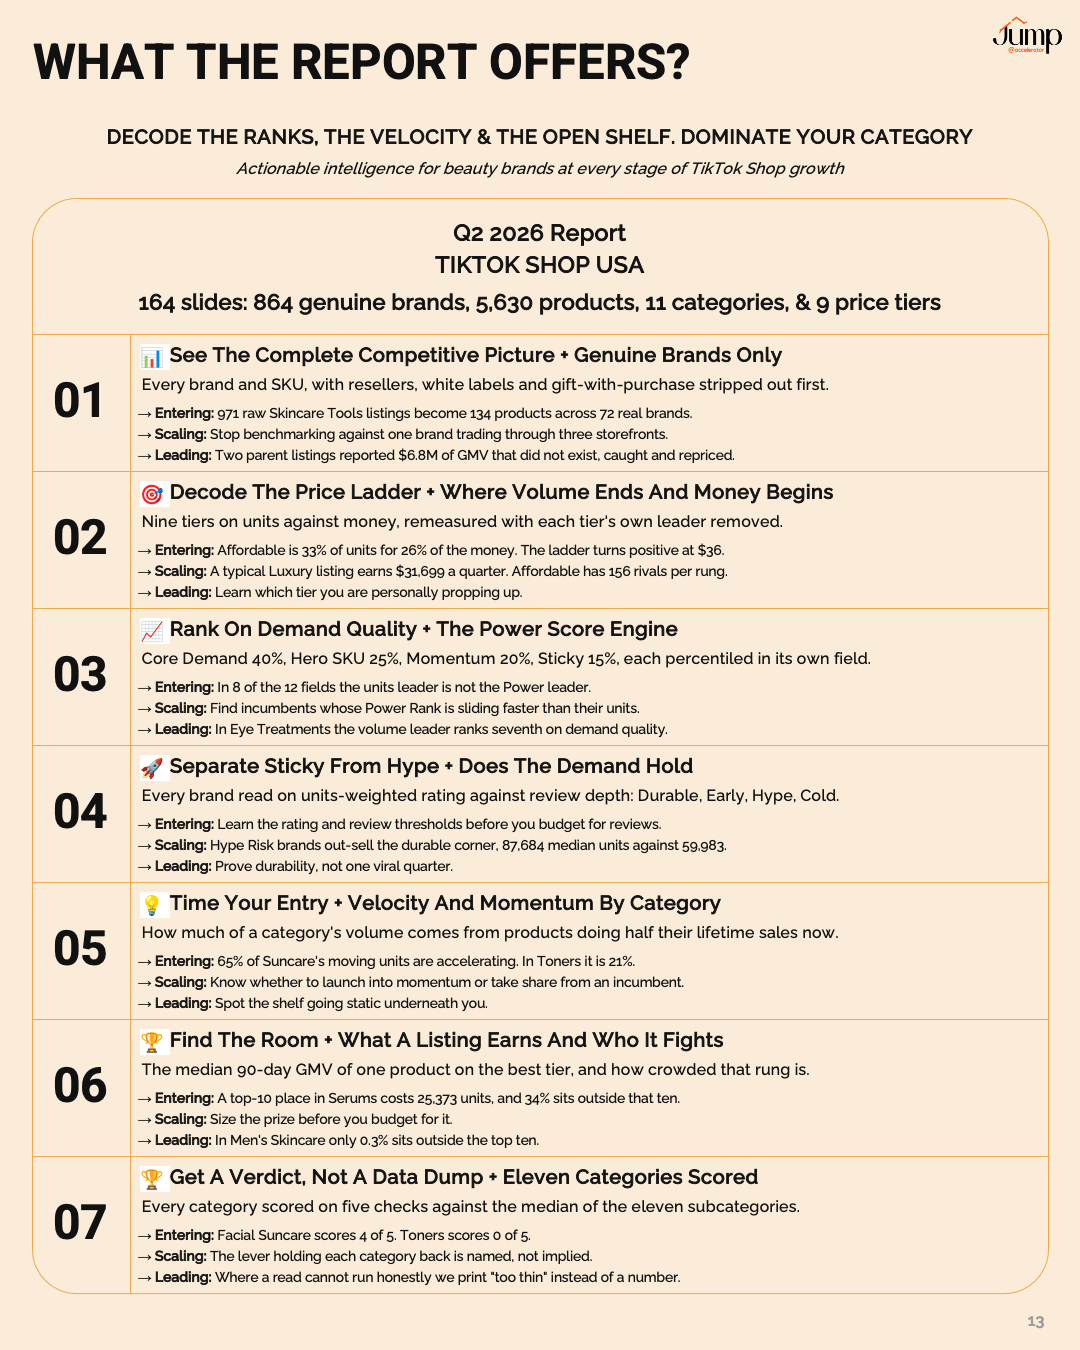
SEVEN WAYS THIS REPORT PAYS OFF
The seven capabilities on the WHAT THE REPORT OFFERS page, in the page’s own words. Each one reads three ways: Entering a category, Scaling in one, Leading one.
1. See The Complete Competitive Picture + Genuine Brands Only
- Entering: Benchmark against brands you can actually beat
- Scaling: Stop counting one seller’s 3 storefronts as 3 rivals
- Leading: Know your real share, not a share of inflated revenue
2. Decode The Price Ladder + Where Volume Ends And Money Begins
- Entering: Choose a tier on evidence, across nine of them
- Scaling: Price where the margin lives, not where the noise is
- Leading: Watch your own price rung filling up behind you
3. Rank On Demand Quality + The Power Score Engine
- Entering: Understand power ranks of leaders
- Scaling: Spot incumbents whose rank is sliding before they do
- Leading: Prove demand quality, not raw volume
4. Separate Sticky From Hype + Does The Demand Hold
- Entering: Budget reviews against a known rating threshold
- Scaling: Build for repeat, not one viral quarter
- Leading: See which rivals crack as their reviews deepen
5. Time Your Entry + Velocity And Momentum By Category
- Entering: Launch into a shelf that is moving, not flat
- Scaling: Choose momentum or share, with the evidence
- Leading: Catch a shelf going static underneath you
6. Find The Room + What A Listing Earns And Who It Fights
- Entering: Enter with a number for what a listing earns
- Scaling: Size the top-ten ticket before you budget for it
- Leading: Know % of shelf behind you
7. Get A Verdict, Not A Data Dump + Eleven Categories Scored
- Entering: Eleven shelves on five checks, before you commit
- Scaling: See the one lever blocking your category
- Leading: Where a read can’t run honestly, we say so
11 CATEGORIES, 9 PRICE TIERS
Overall Skincare · Serums & Essences · Moisturisers & Mists · Face Masks · Facial Suncare & Sunscreen · Lip Treatments · Eye Treatments · Toners · Facial Cleansers · Acne Treatments · Skincare Tools · Men’s Skincare
Access the Q2 2026 TikTok Shop USA Skincare Intelligence Report now!
750+ beauty pros trust Jump’s beauty reports.
Preview
Preview
Preview
Description
DECODE THE Q2 2026 TIKTOK SHOP SKINCARE RANKS, MOMENTUM & CATEGORY DEEP DIVE. THE INTELLIGENCE THAT SEPARATES A LISTING FROM SCALE.
SCALE IN 2026.
Anyone can sell on TikTok Shop. But can you scale on it?
No buyer to convince. No shelf to win. The barrier is durable velocity, and this report decodes it category by category.
Who is it for?
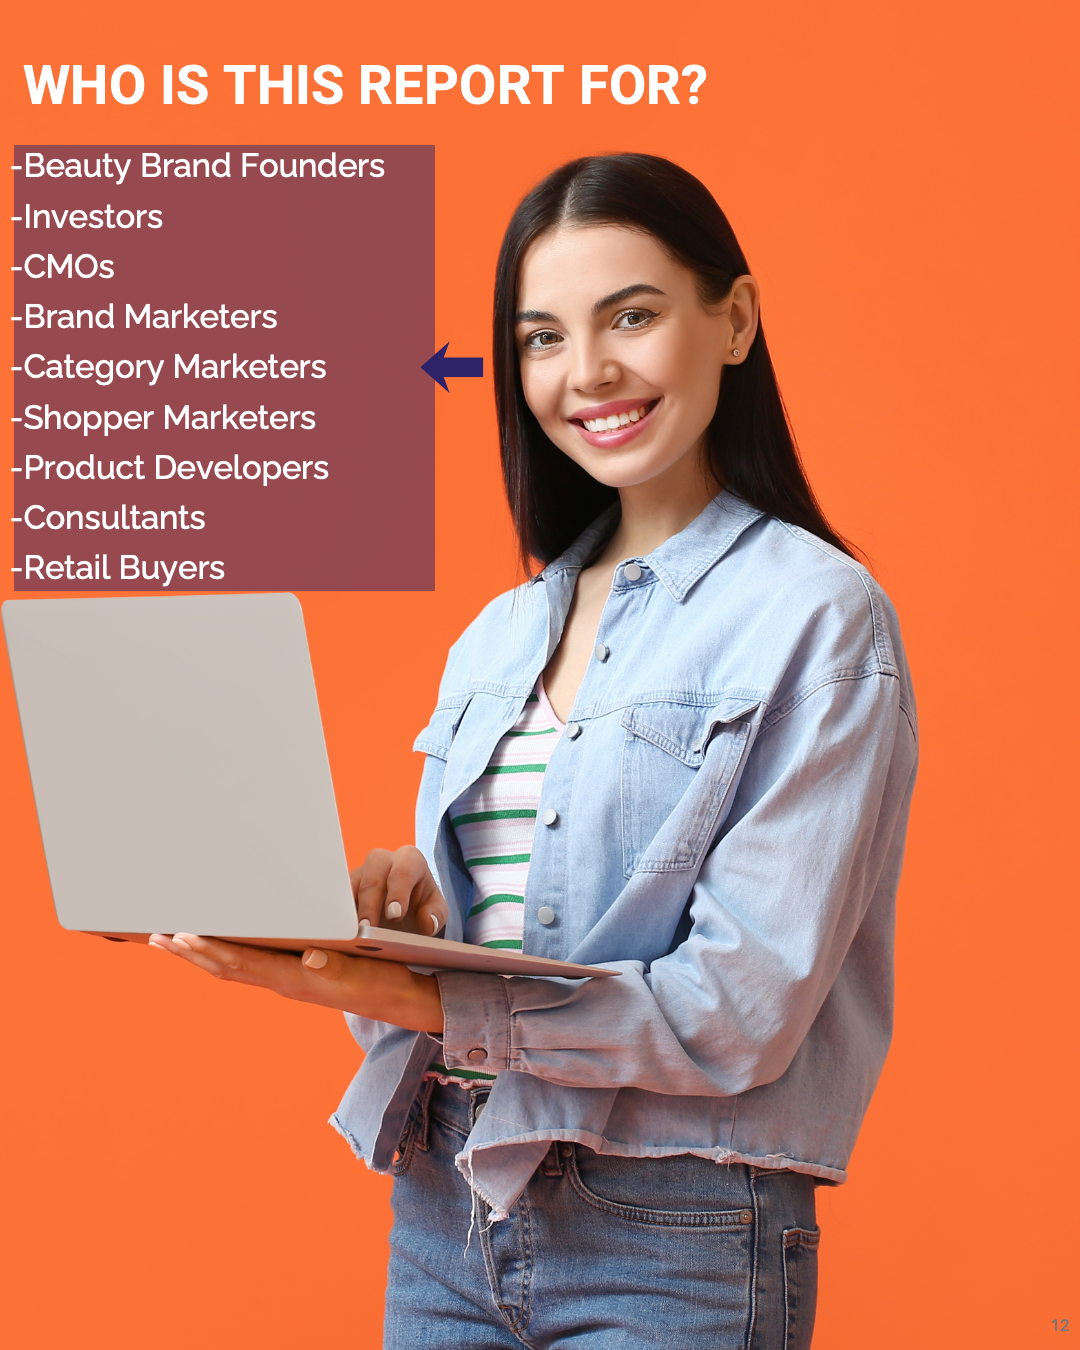
Beauty brand founders, CMOs, investors, brand and category marketers, consultants, product developers and TikTok Shop operators.
Q2 2026 TikTok Shop USA Skincare in 164 slides: 864 genuine brands, 5,630 products, $254.7M in actual 90-day sales, 11 categories, 9 price tiers.
Every block reads three ways: Entering a category, Scaling in one, Leading one.
🧹 First, the Field Needs Hygiene
Resellers, white labels, retailers and gift-with-purchase listings stripped out before a single number runs. In Skincare Tools that removed 54% of reported revenue.
→ Entering: The raw export lists 971 skincare tool listings. Only 134 survive, across 72 real brands.
→ Scaling: Stop benchmarking against one brand trading through three storefronts.
→ Leading: Two listings in the parent file reported $6.8M of GMV that did not exist, on a corrupted price column. We caught it against the brand’s own site and repriced it.
Proof: in Toners, 50 listings were not toners at all and 35 more came from 16 reseller and white-label shops, each verified on the brand’s own page.
🗺️ LAND: Where to Play
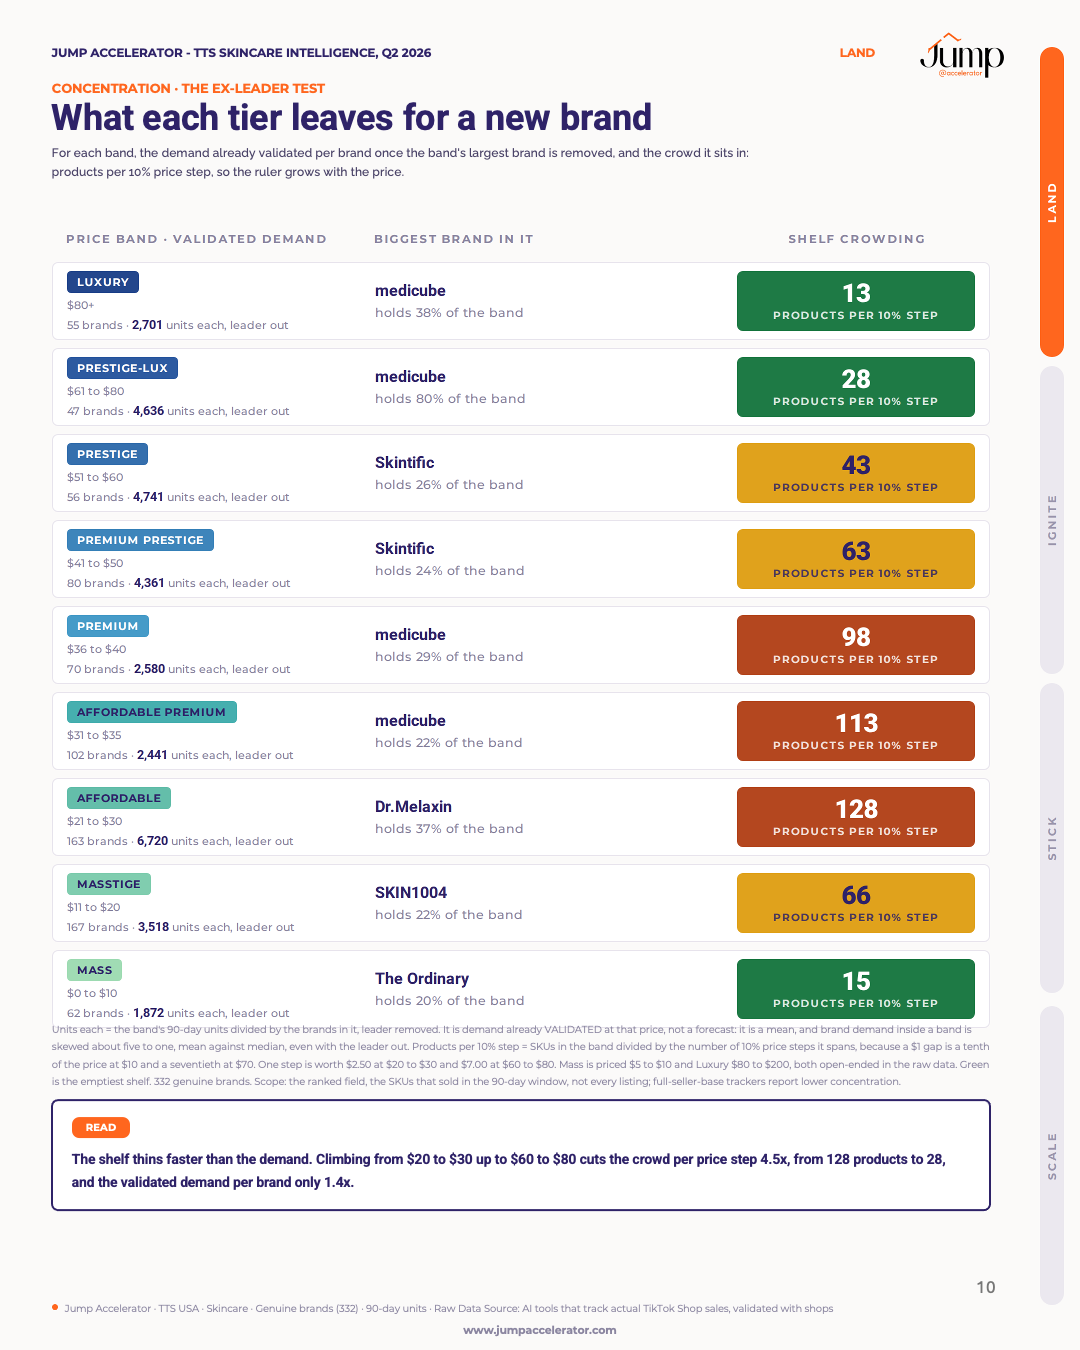
Price Architecture and the Ex-Leader Test Demand across 9 tiers, units versus GMV, then remeasured per brand with each tier’s leader removed.
→ Entering: Most tiers are mirages. Find the one that survives its own leader.
→ Scaling: Price where volume and margin diverge, not where the noise is.
→ Leading: Learn which tier you are personally propping up.
What a Listing Earns, and Who It Shares the Rung With The median 90-day GMV of one product on each tier, leader removed, beside how many rivals share every 10% price step.
→ Entering: Affordable holds the most demand in skincare and the most crowded shelf on the board: 156 products per 10% price step.
→ Scaling: A typical Luxury listing in Serums earns $2,507 a quarter. A typical Moisturisers listing on its best tier earns $758.
→ Leading: See whether your price rung is filling up behind you.
Proof: one category’s leader holds 78% of its GMV across nineteen brands.
⚡ IGNITE: How to Gain Velocity
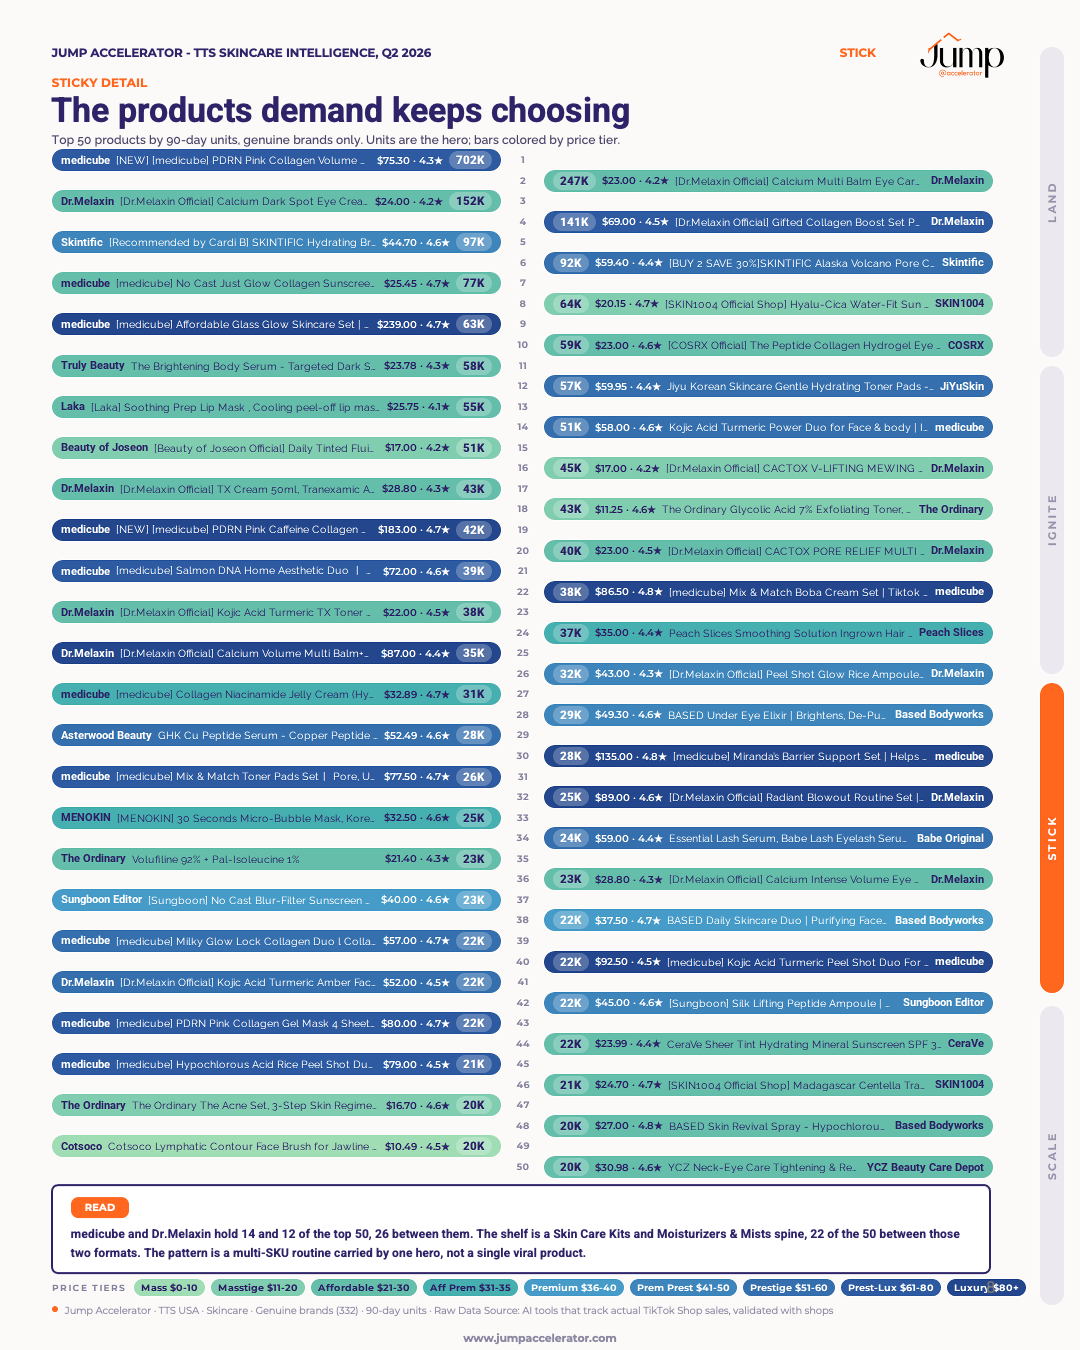
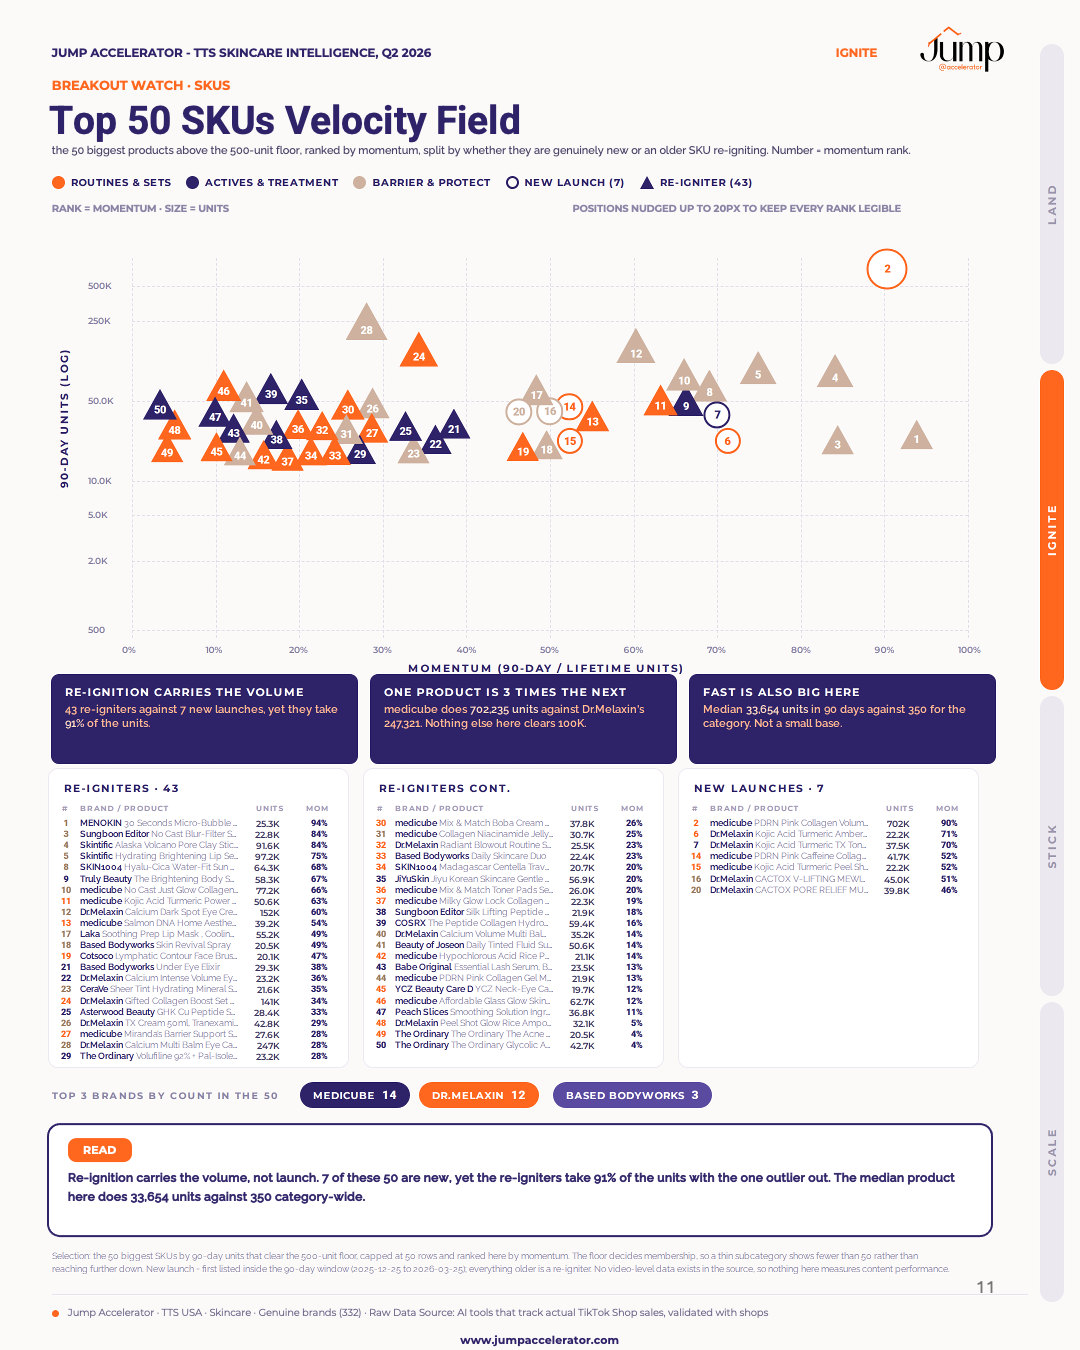
The Velocity Field The SKUs actually clearing a real unit floor, with formats derived from each category’s own products. Everything else is shelf decoration.
→ Entering: In Face Masks, sheet masks are 36% of the shelf and 11% of demand. In Toners, hydrating toners are 28% of the shelf and 3% of demand.
→ Scaling: Build the format breaking out. Kill the SKU padding your catalogue.
→ Leading: Check your hero is still in the field.
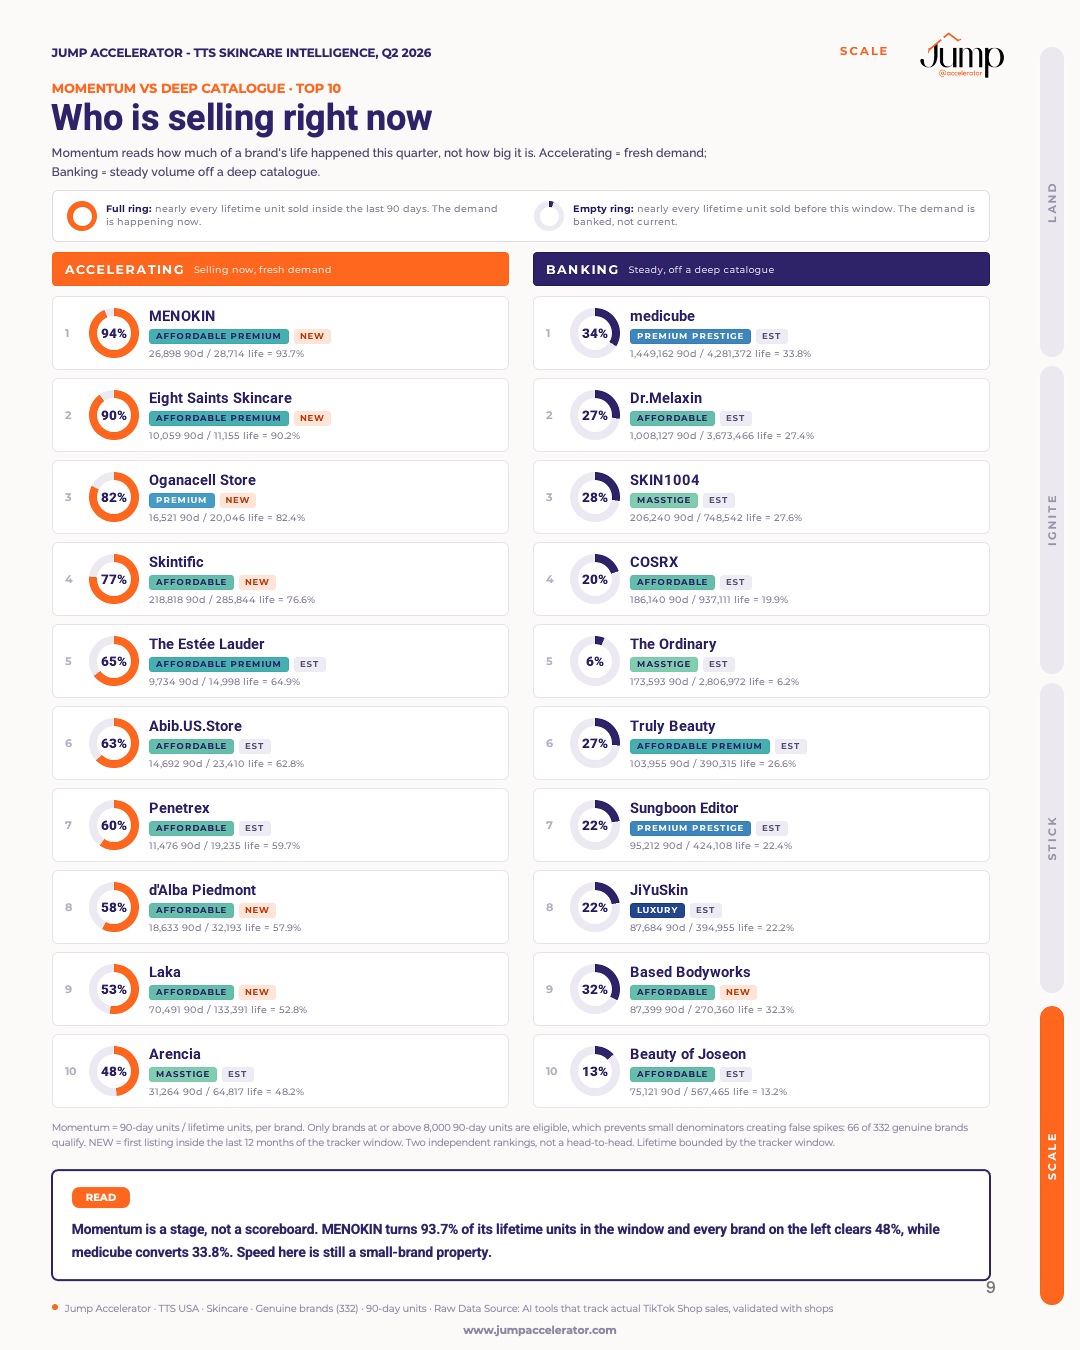
Accelerating versus Coasting Every category read on how much of its moving volume comes from products doing half or more of their lifetime sales inside the window.
→ Entering: 65% of Suncare’s moving units are accelerating right now. In Toners it is 21%. One of those shelves carries a launch. The other does not.
→ Scaling: Know whether to launch into momentum or take share from an incumbent.
→ Leading: Spot the shelf going static underneath you.
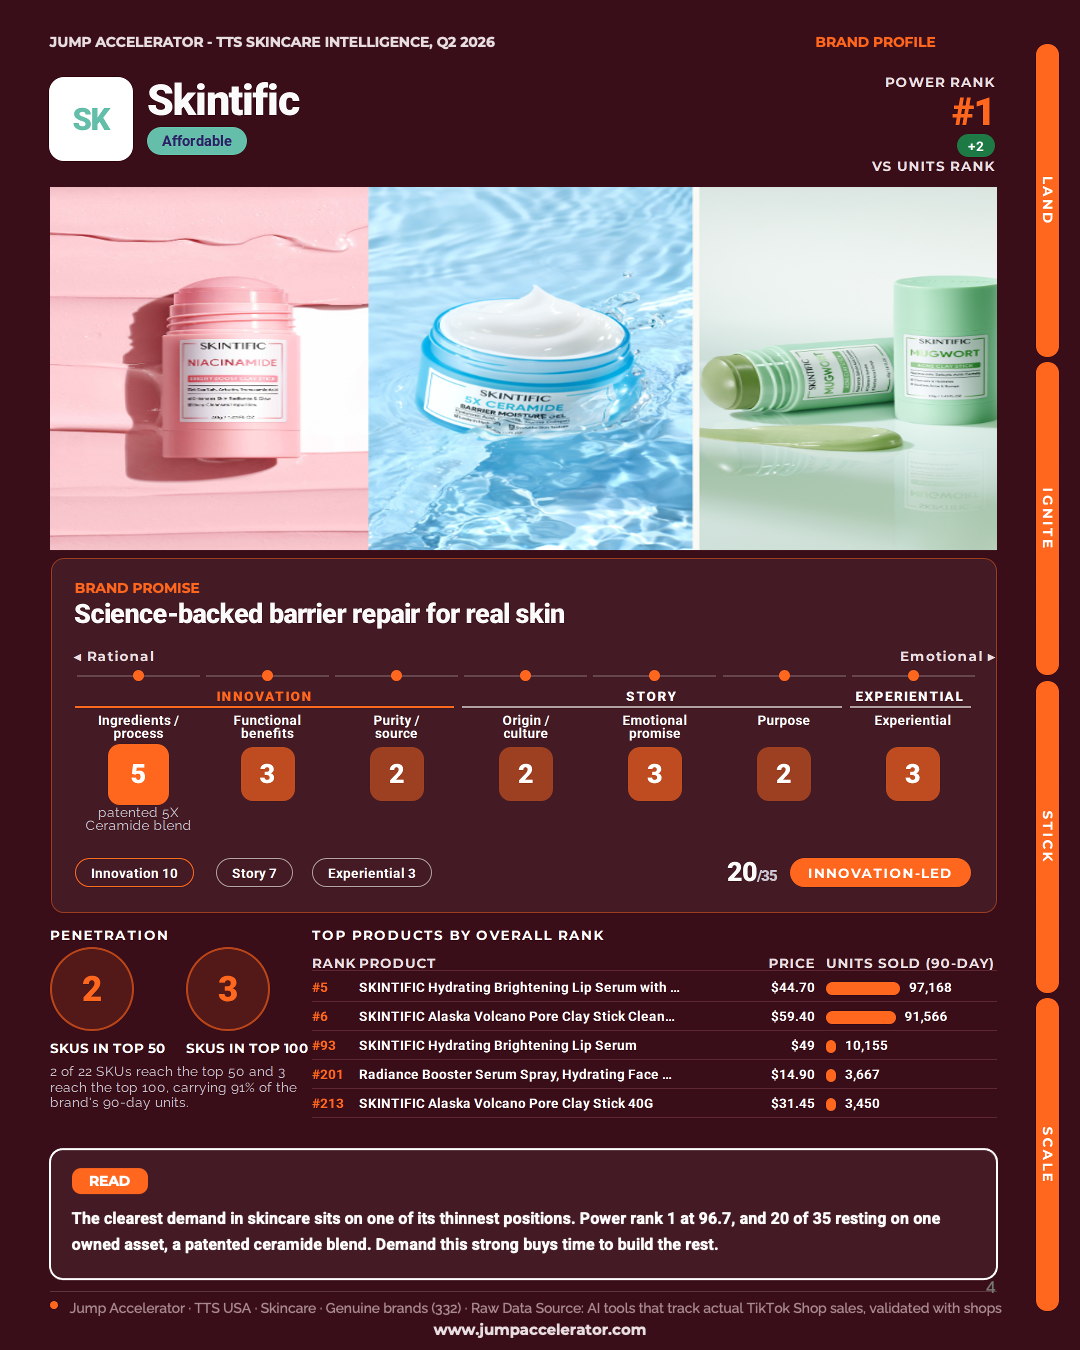
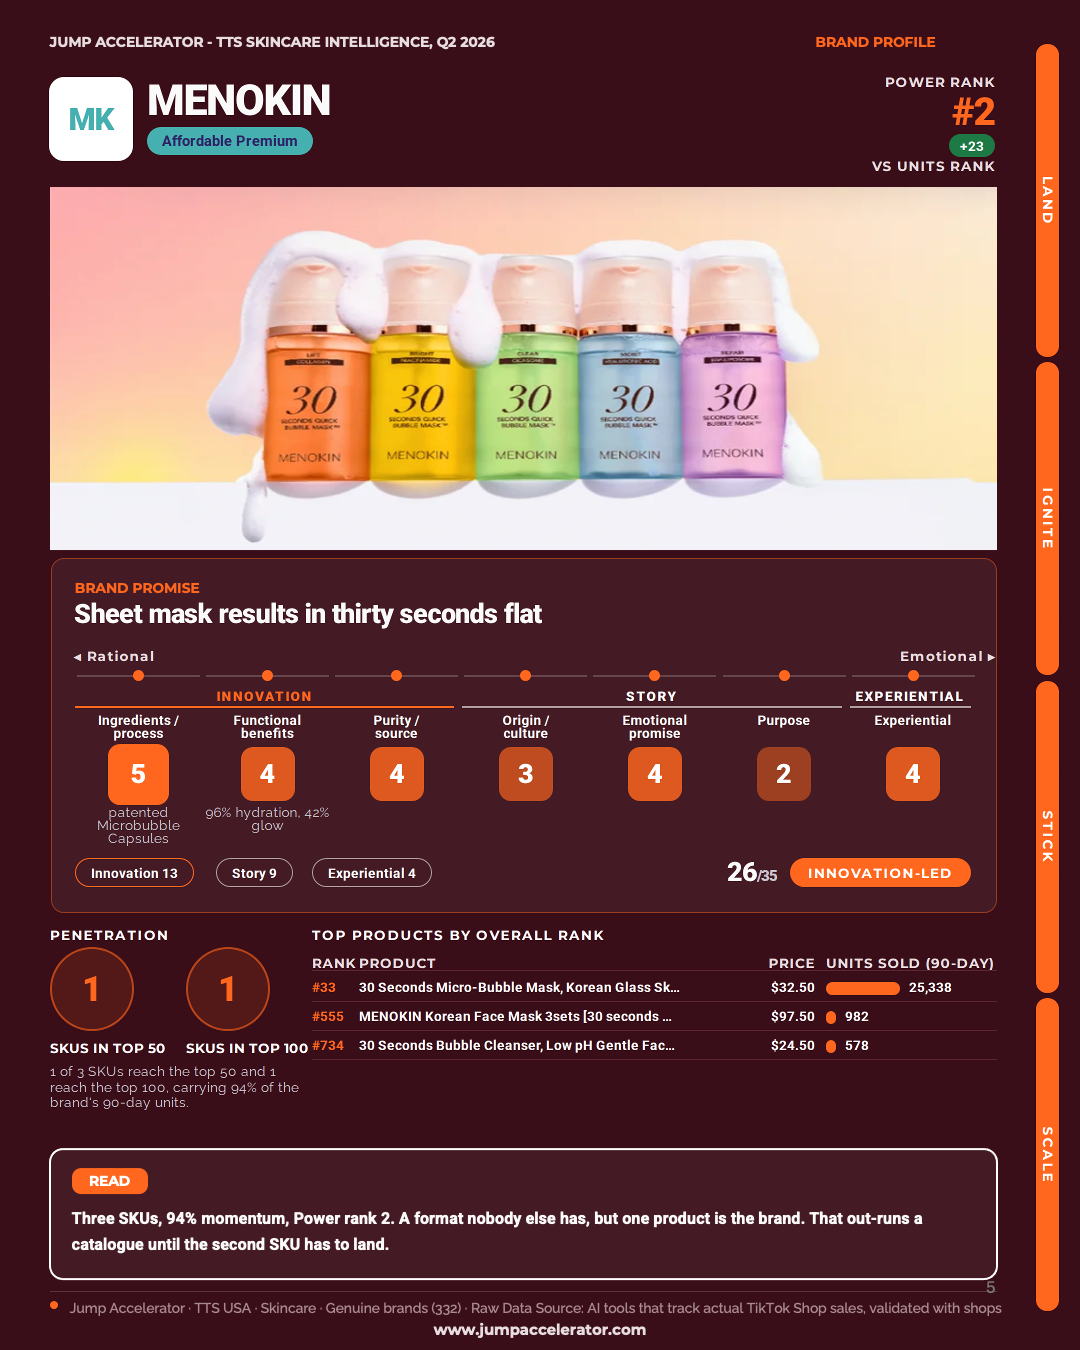
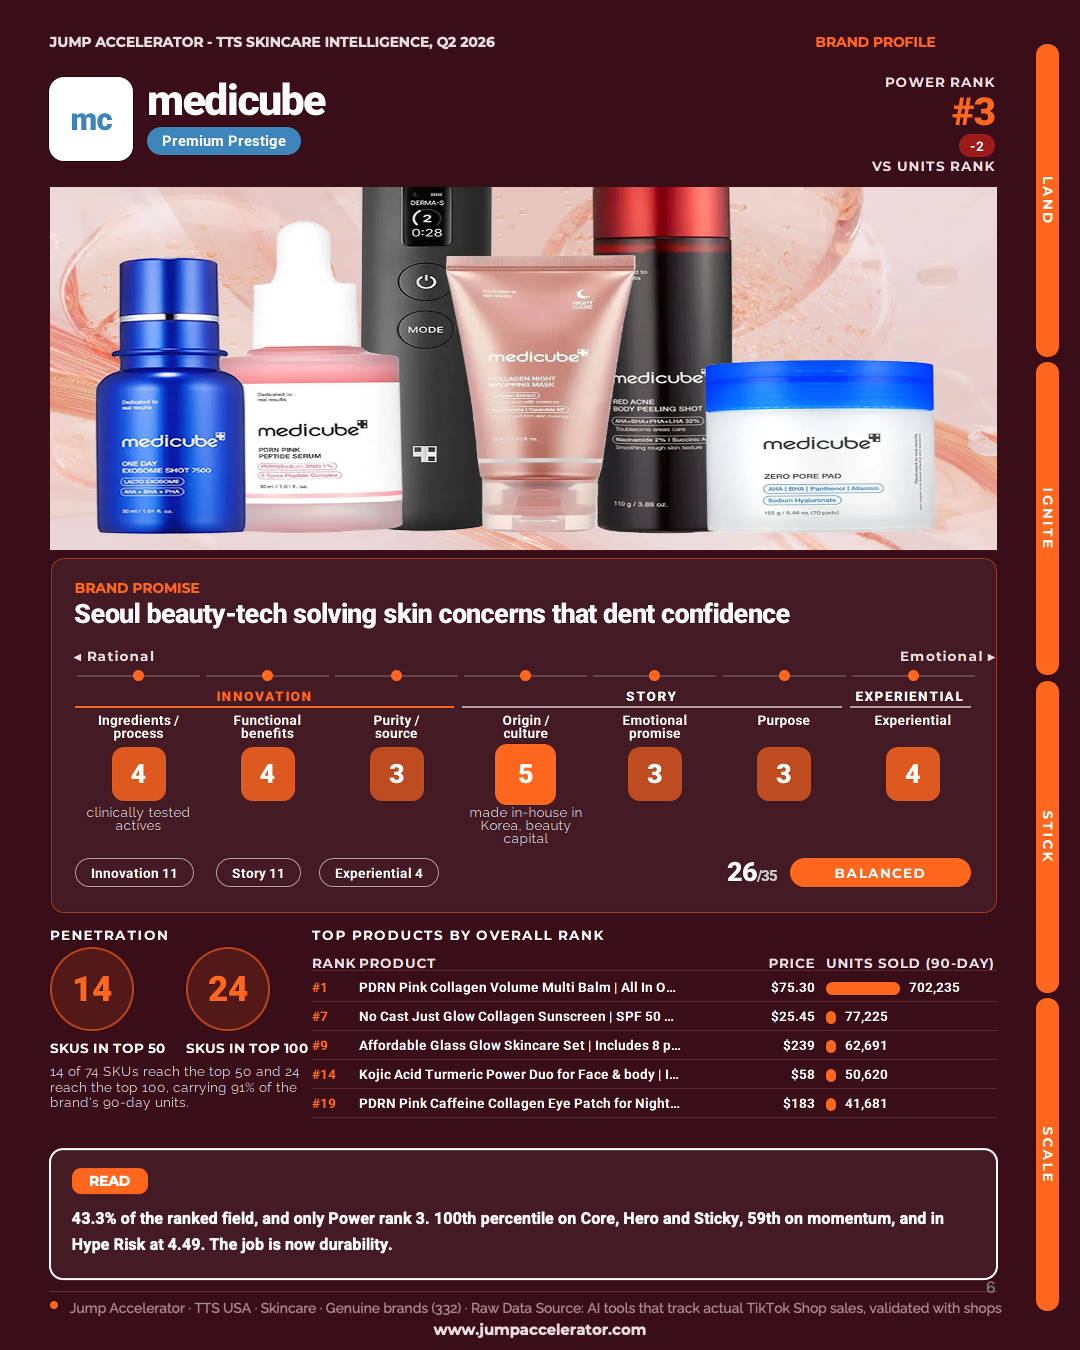
Positioning White Space Seven stopovers scored rational to emotional: Ingredients, Functional Benefits, Purity, Origin, Emotional Promise, Purpose, Experiential.
→ Entering: Take an angle no incumbent owns.
→ Scaling: Claim the unowned stopover next to you.
→ Leading: See where your center of gravity has drifted.
🔒 STICK: Does It Hold
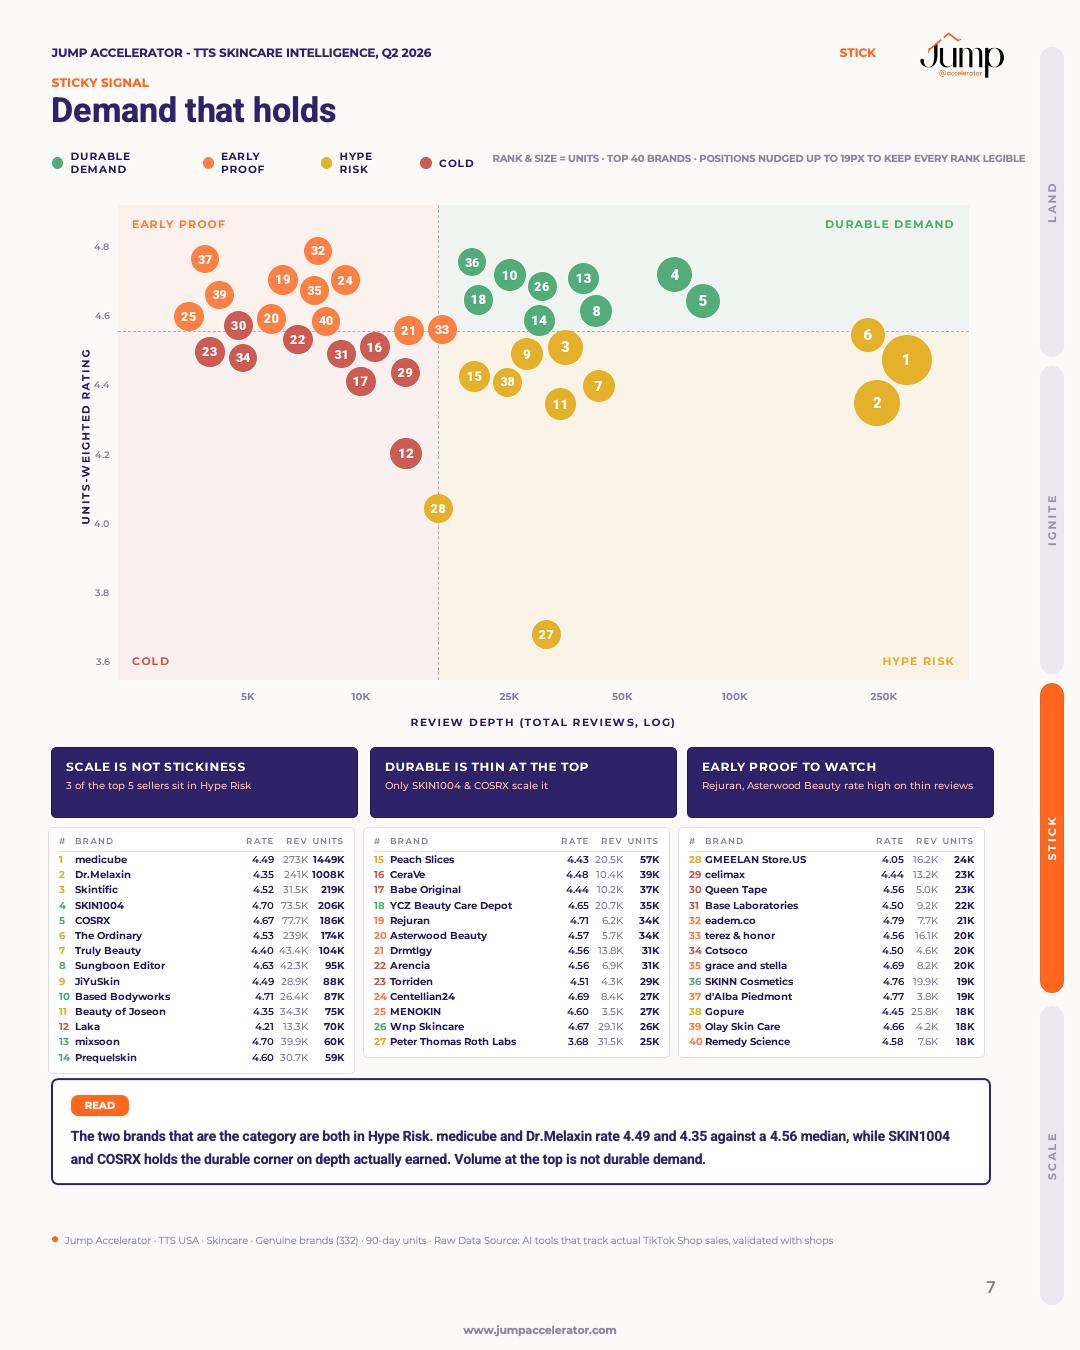
The Sticky Signal Quadrant Every brand read on units-weighted rating and review depth: Durable, Early, Hype, Cold.
→ Entering: Learn the rating and review thresholds before you budget for reviews.
→ Scaling: See which brands hold rating as reviews deepen, and which crack.
→ Leading: Prove durability, not one viral quarter.
Proof: in Overall Skincare the Hype Risk corner has the highest median units of any quadrant, 87,684 against Durable Demand’s 59,983. The biggest sellers in skincare are the ones with deep review counts and weak ratings.
🏆 SCALE: Who Actually Leads
Power Rank vs Raw Units, and the Rank Shifts
Power Score ranks demand quality, not size: Core Demand 40%, Hero SKU 25%, Momentum 20%, Sticky 15%.Every row carries its shift badge against raw units: riser, faller, level or new.
→ Entering: In Eye Treatments the units leader ranks seventh on Power. In Moisturisers, sixth. Find out if that is you.
→ Scaling: Find incumbents whose Power Rank is sliding faster than their units.
→ Leading: Six of the eleven categories have a units leader who is not the Power leader.
The Top-Ten Floor What the tenth brand actually sold, and how much of the category is still outside that ten.
→ Entering: A top-ten place in Serums costs 25,373 units, and 34% of the category still sits outside the top ten. In Men’s Skincare it is 0.3%.
→ Scaling: Size the prize before you budget for it.
→ Leading: Know how much room is left behind you.
Too thin to name accelerators honestly? We drop the read rather than invent risers. Three categories are marked unreadable on velocity, not estimated.
🧭 THE PLAY: The Read Becomes a Plan
The Brand Lens Every category closes on the five decisions in the order you make them: MARKET, LAND, IGNITE, STICK, SCALE. Each one states what the quarter’s data says and the single move it points at, then scores the category against the median of the eleven.
→ Entering: Leave with an entry lane, an entry price and the brand you will actually fight.
→ Scaling: A growth strategy by category, with tier, price and incumbent named.
→ Leading: A specific move per section, not a summary of the quarter.
📚 11 Categories, Each With Its Own Deck
Overall Skincare · Serums & Essences · Moisturisers & Mists · Face Masks · Facial Suncare & Sunscreen · Lip Treatments · Eye Treatments · Toners · Facial Cleansers · Acne Treatments · Skincare Tools · Men’s Skincare
Vitals, price architecture, concentration, velocity, sticky signal, power rank, the brand lens, and the full league table with no truncation.
9 tiers: Mass ($0-10) · Masstige ($11-20) · Affordable ($21-30) · Affordable Premium ($31-35) · Premium ($36-40) · Premium Prestige ($41-50) · Prestige ($51-60) · Prestige-Lux ($61-80) · Luxury ($80+)
How Do We Collect Data?
Actual TikTok Shop sales using multiple platforms and tools, validated with shops. Not modelled estimates.
The Power Score weights sustained performance over viral moments:
Core Demand 40%, Hero SKU 25%, Momentum 20%, Sticky 15%, each percentiled across the cleaned genuine-brand base.
Every index carries a disclosed floor. Every exclusion is listed. Counts are deduplicated on the platform’s own product ID, so a product listed in both a category and the market above it is counted once. Where a screen cannot run honestly, we say so instead of filling the space with a chart.
Start from the decoded picture instead.
(Save tens of thousands of dollars in consulting and hundreds of hours in research and analysis.)
750+ Beauty PROs trust Jump Reports.
Access the Q2 2026 TikTok Shop USA Skincare Intelligence Report now!