



Suzanne LeRoux
Rohit,
This is incredibly useful work-especially the sections on top-ranking brands (and why), individual product rankings, category winners, and the white space vs. saturation analysis. That’s where it becomes most strategic for me. Some sections feel a little dense. Overall, the competitive visibility is excellent.”
Suzanne LeRoux
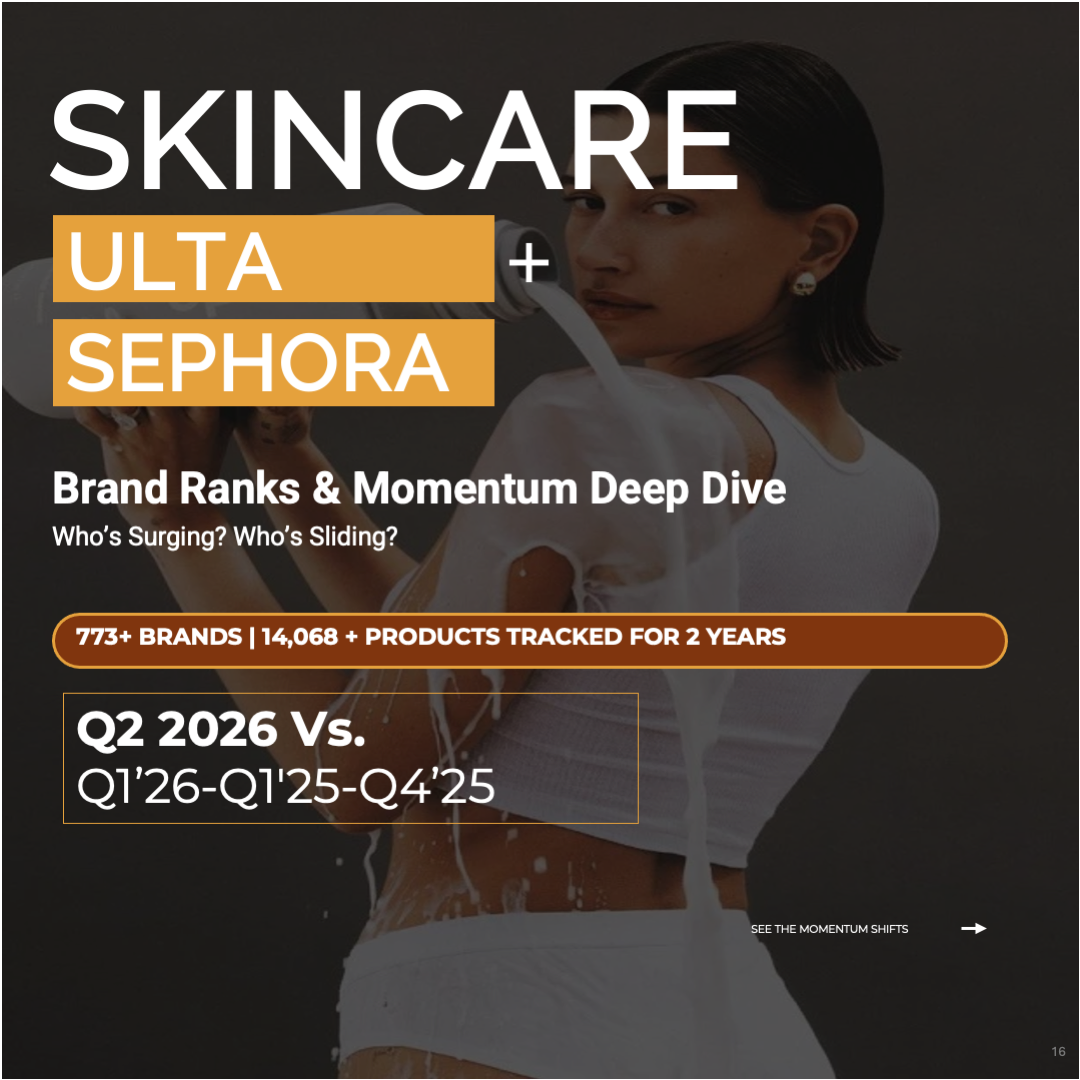
Q2 2026 Skincare: Ulta + Sephora Brand Ranks, Momentum & Competitive Intelligence Vs. Q1’26-Q1’25
$399.00
SCROLL DOWN TO PREVIEW BELOW.
Stop Guessing. Start Winning.
EXECUTIVE SUMMARY
Ulta and Sephora both sell skincare, and they are not running the same category.
Ulta ranks 6,346 products across 512 brands this quarter; Sephora ranks 2,650 across 190. Of the 645 brands holding shelf on the two overall boards, only 57 hold it at both, so a skincare brand is almost always a one-door brand. The two doors are also travelling in opposite directions: at Ulta 215 brands climbed against 136 sliding, and 6 brands were new; at Sephora 54 climbed against 80 sliding and 30 peaked, with 24 brands new.
Ulta rewards the brand that already ranks, Sephora re-lets its shelf every quarter, and the same product feels both. Of the 293 products ranked at both doors in Q1’26 and Q2’26, 184 gained ground at Ulta and 84 at Sephora, and 154 moved in opposite directions at the same moment.
Entry cost follows: Sephora’s ten deepest brands hold 19% of its board against 10% at Ulta, and Sephora turns its shelf over faster on 6 of the 6 categories both doors run.
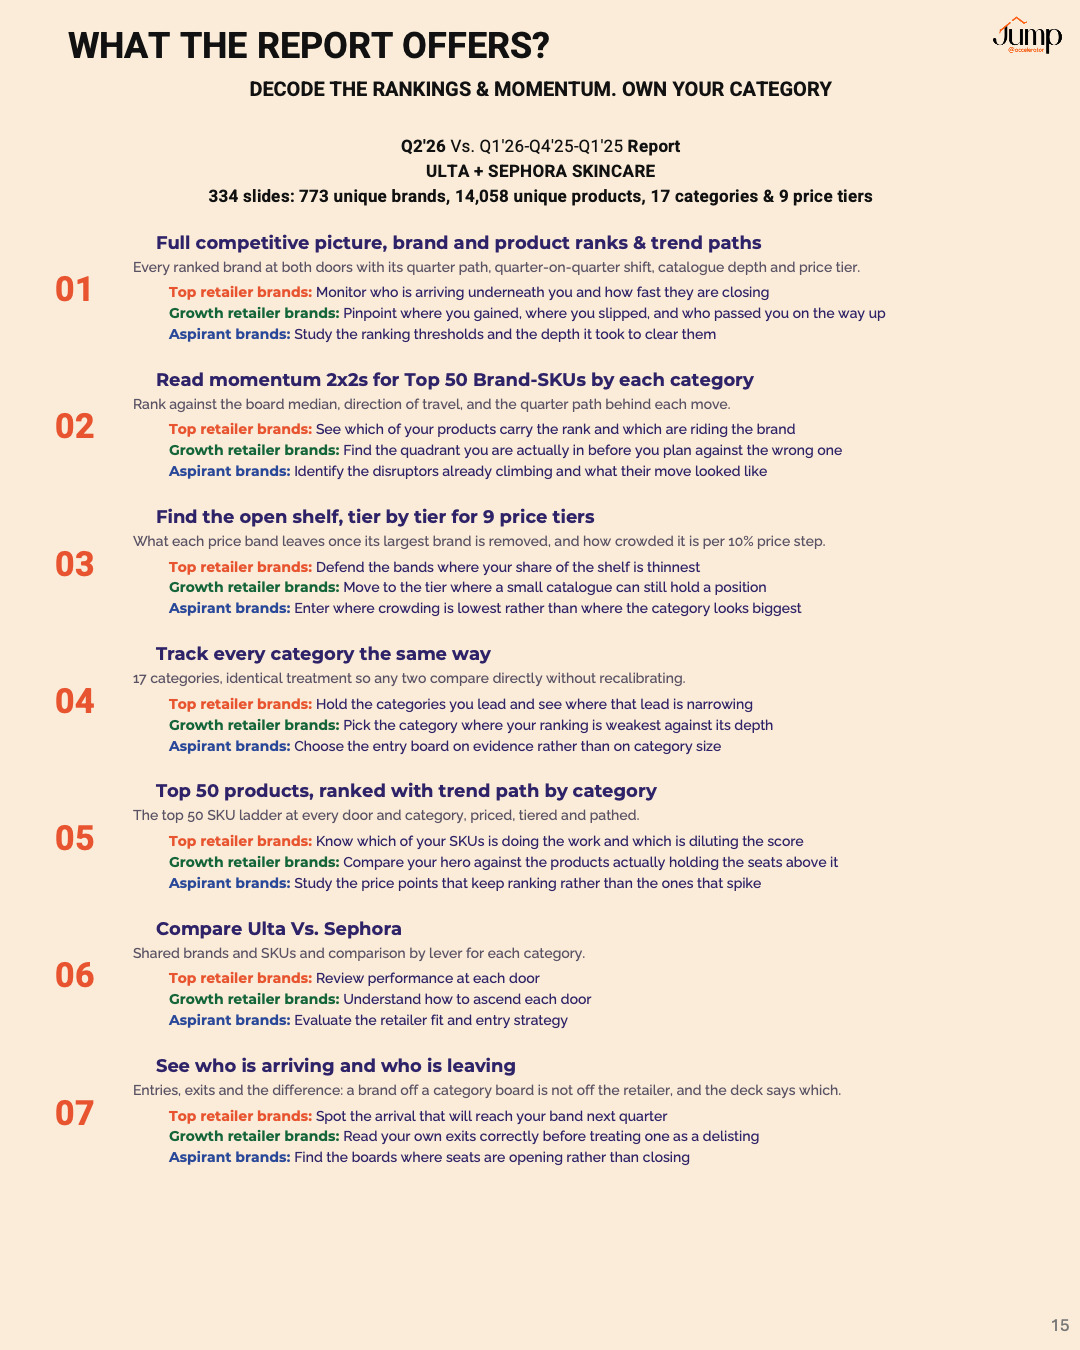
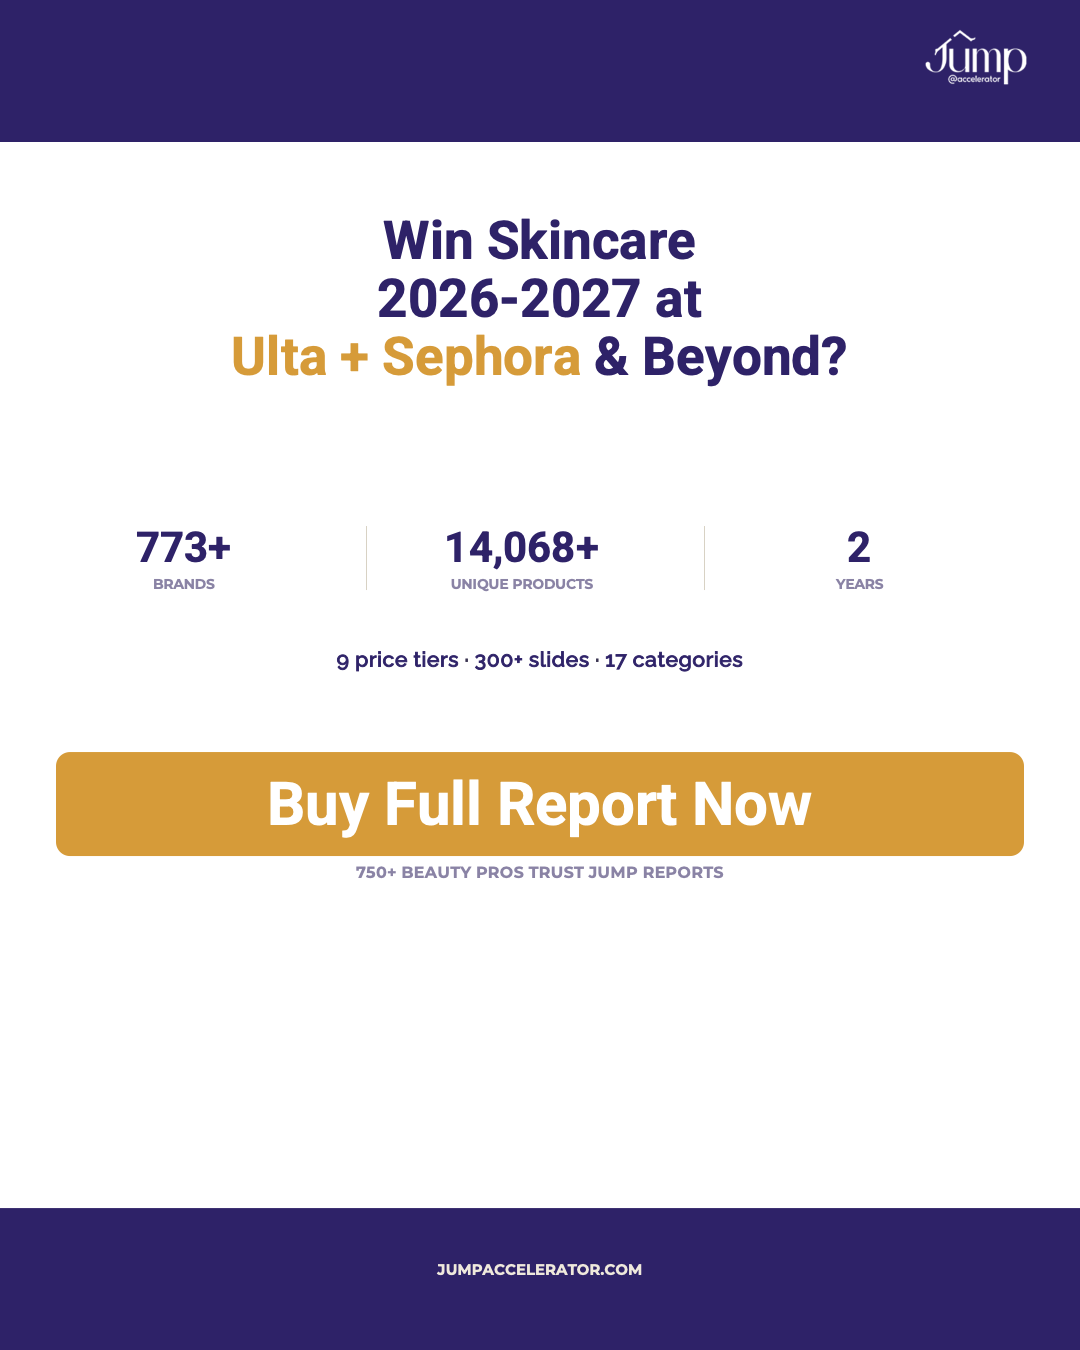
Q2 2026 against Q1 2026, Q4 2025 and Q1 2025: 334 slides, 773 brands, 14,058 ranked products, 17 categories, 9 price tiers, every quarter ranked on its own full captured shelf.
Save thousands in consulting and hundreds of hours in research.
Complete Data Coverage: ULTA + SEPHORA Q2’26 Vs. Q1’25-Q4’25-Q1’26 | Tracked over 2 years
You Get:
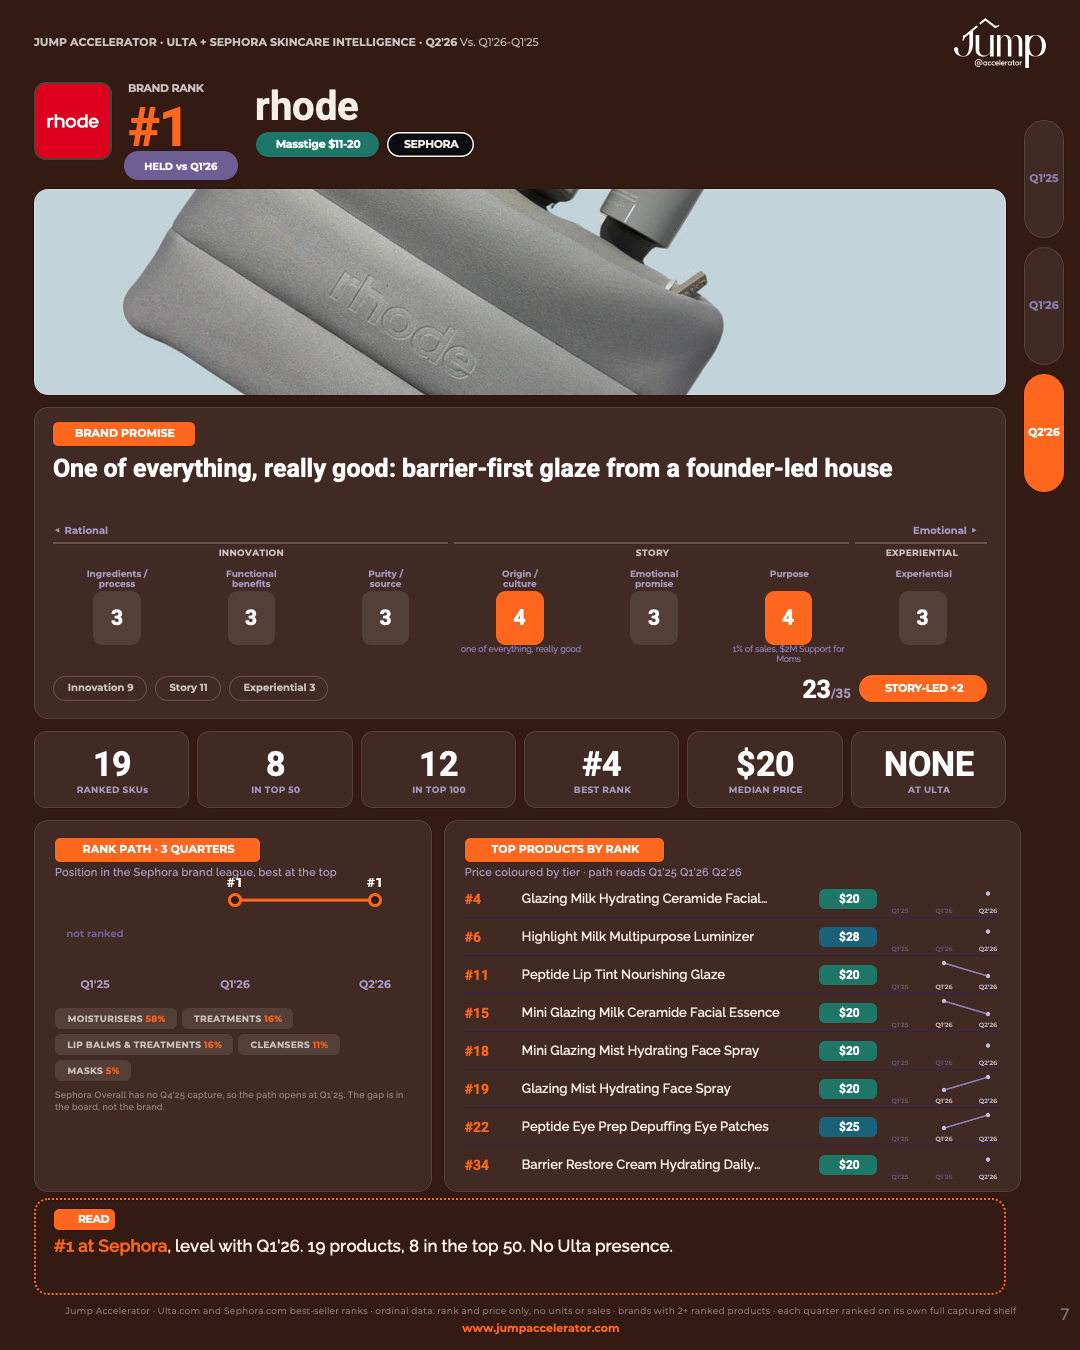
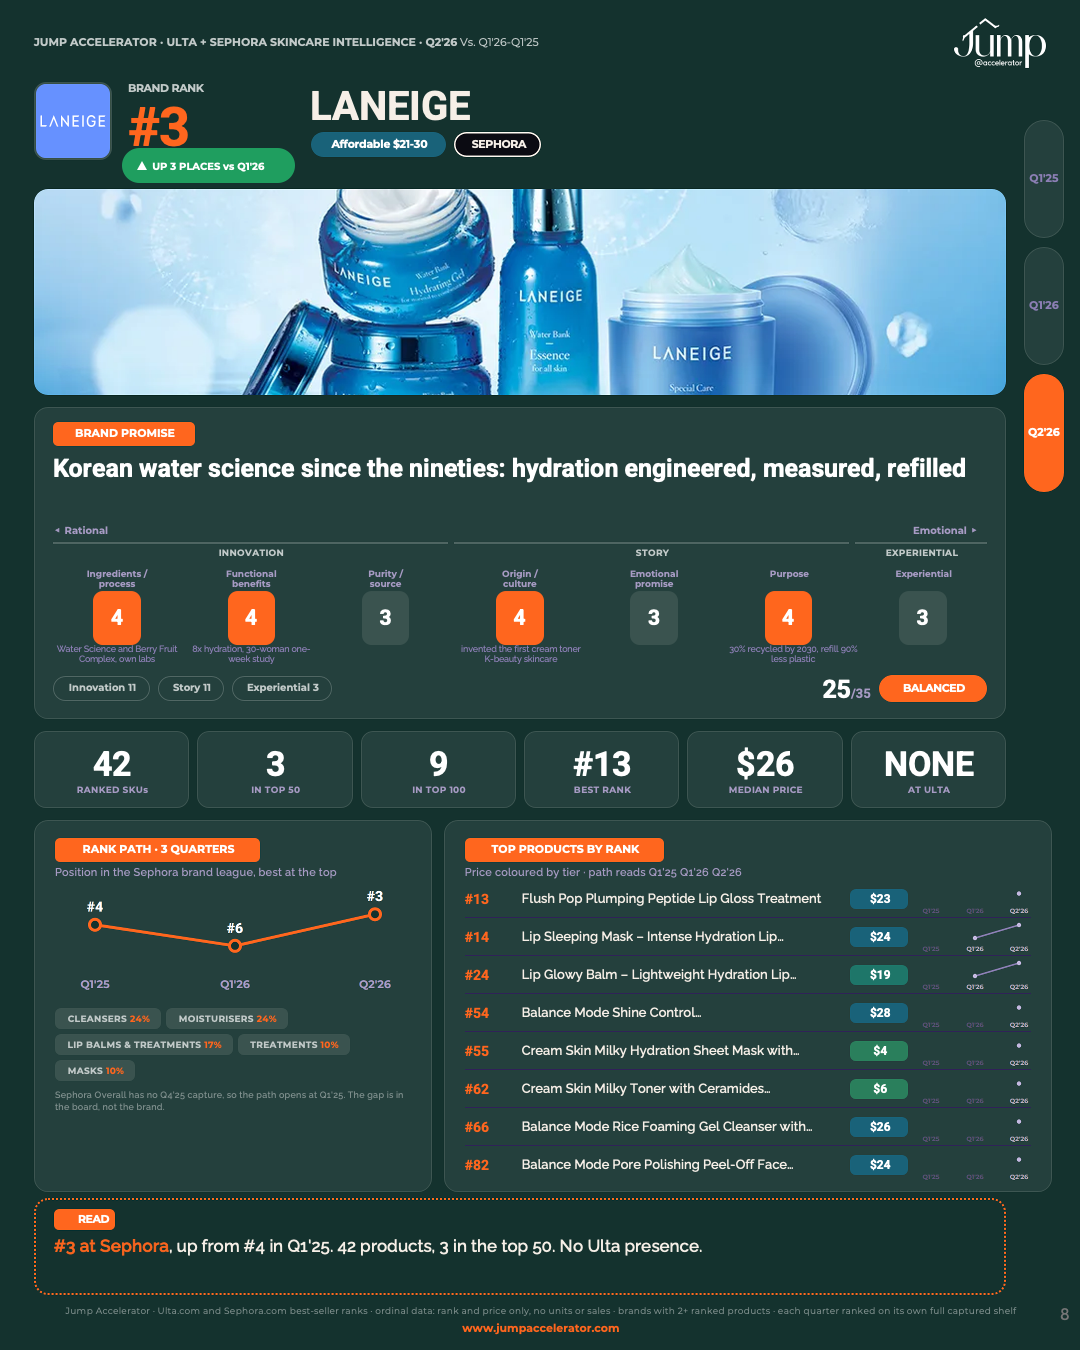
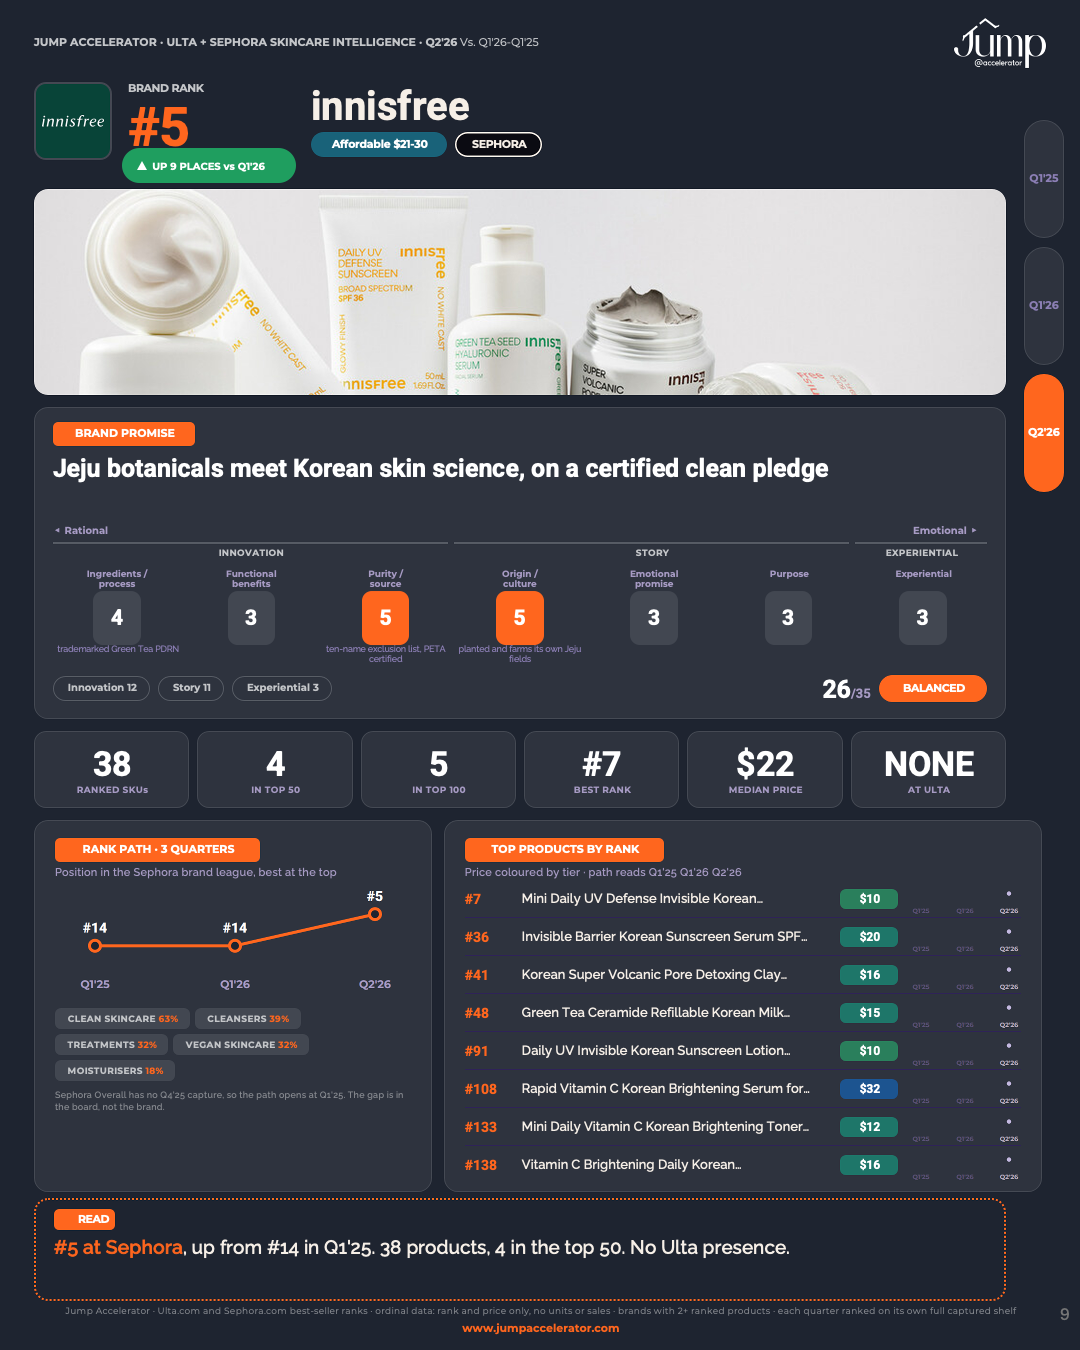
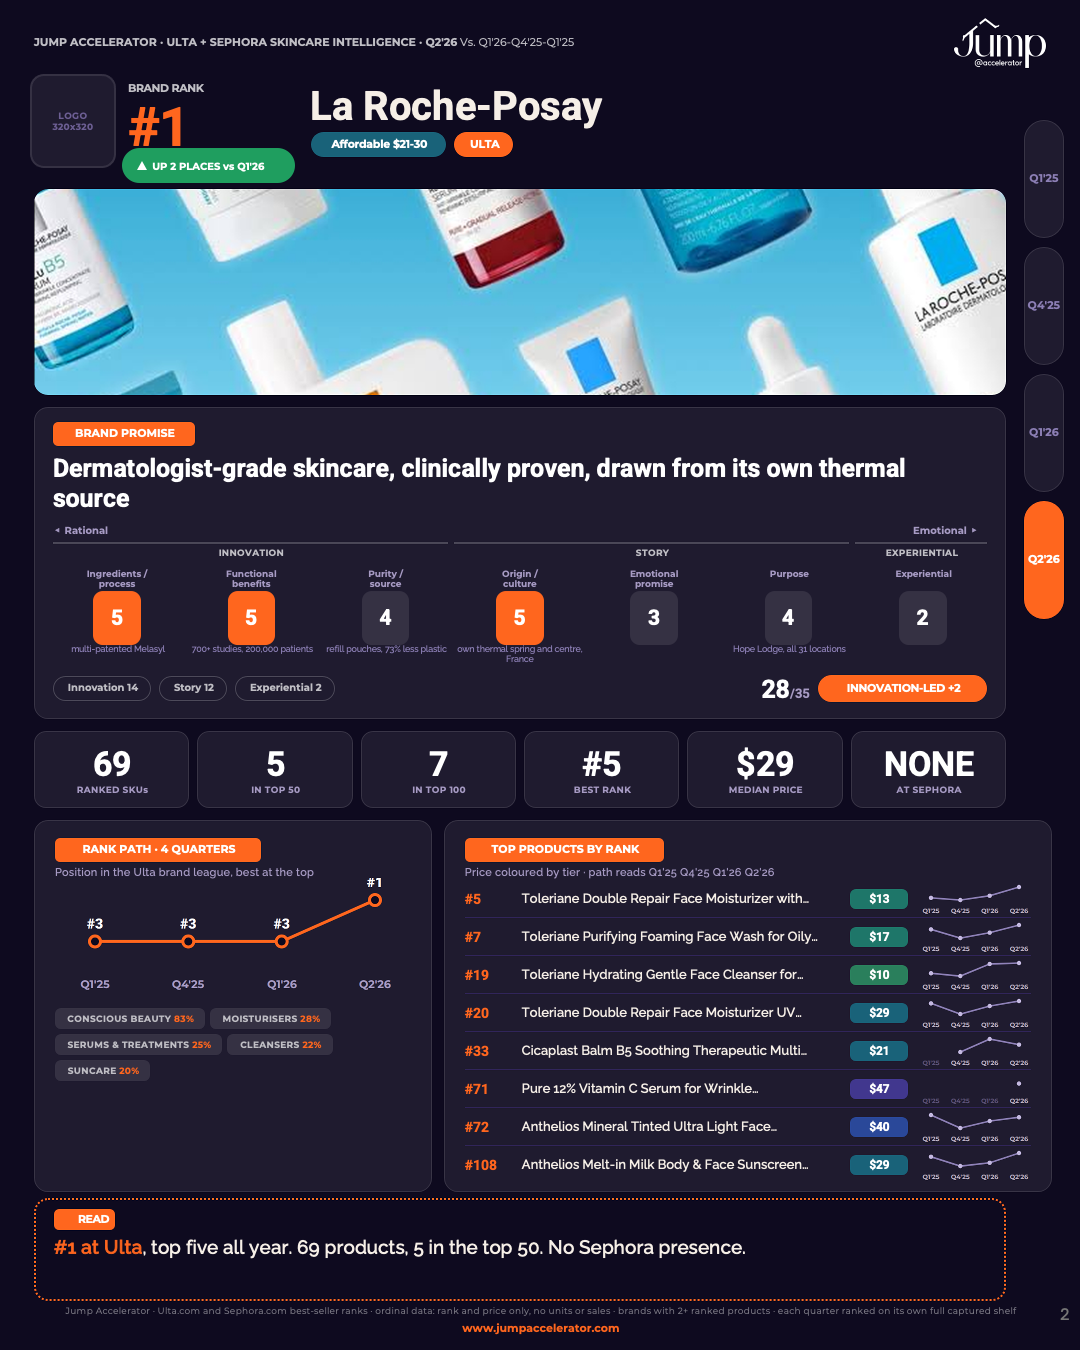
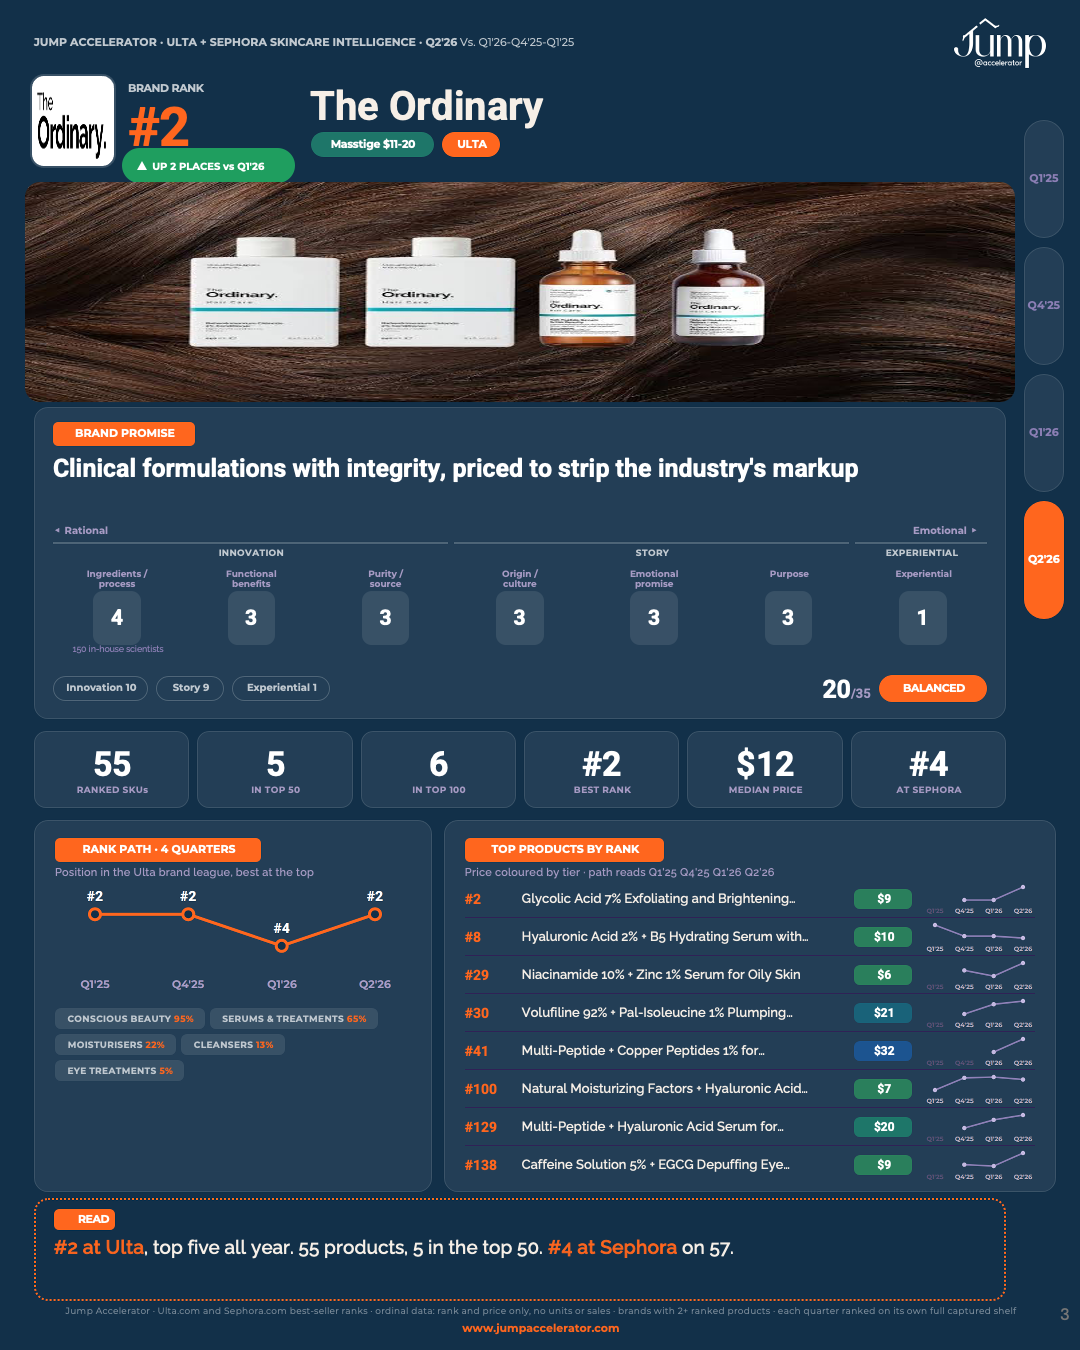
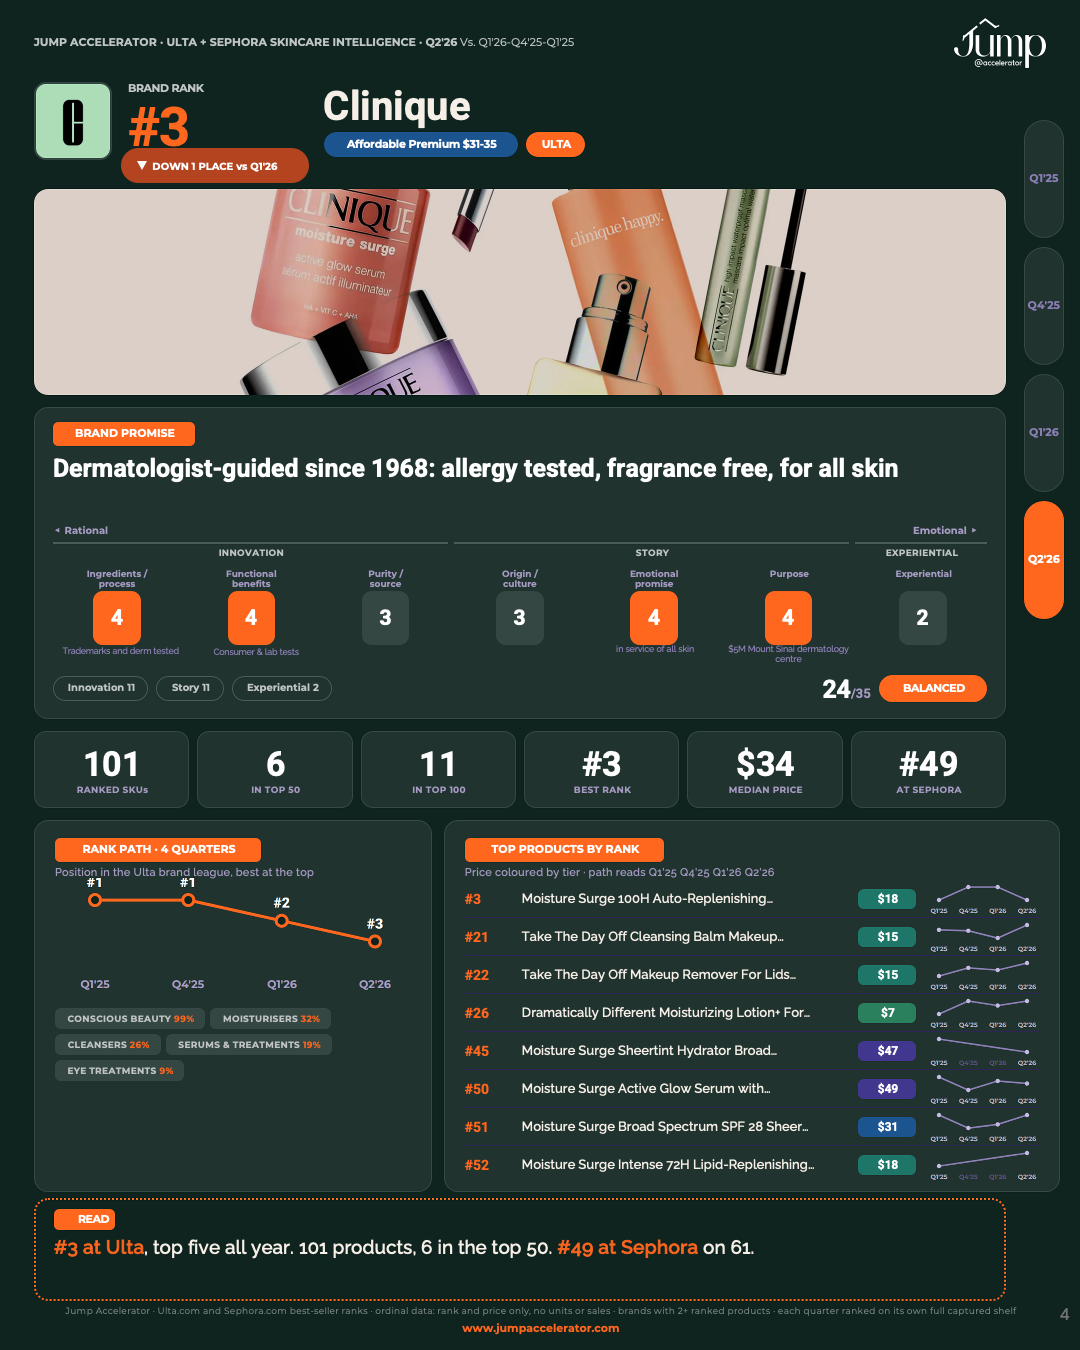
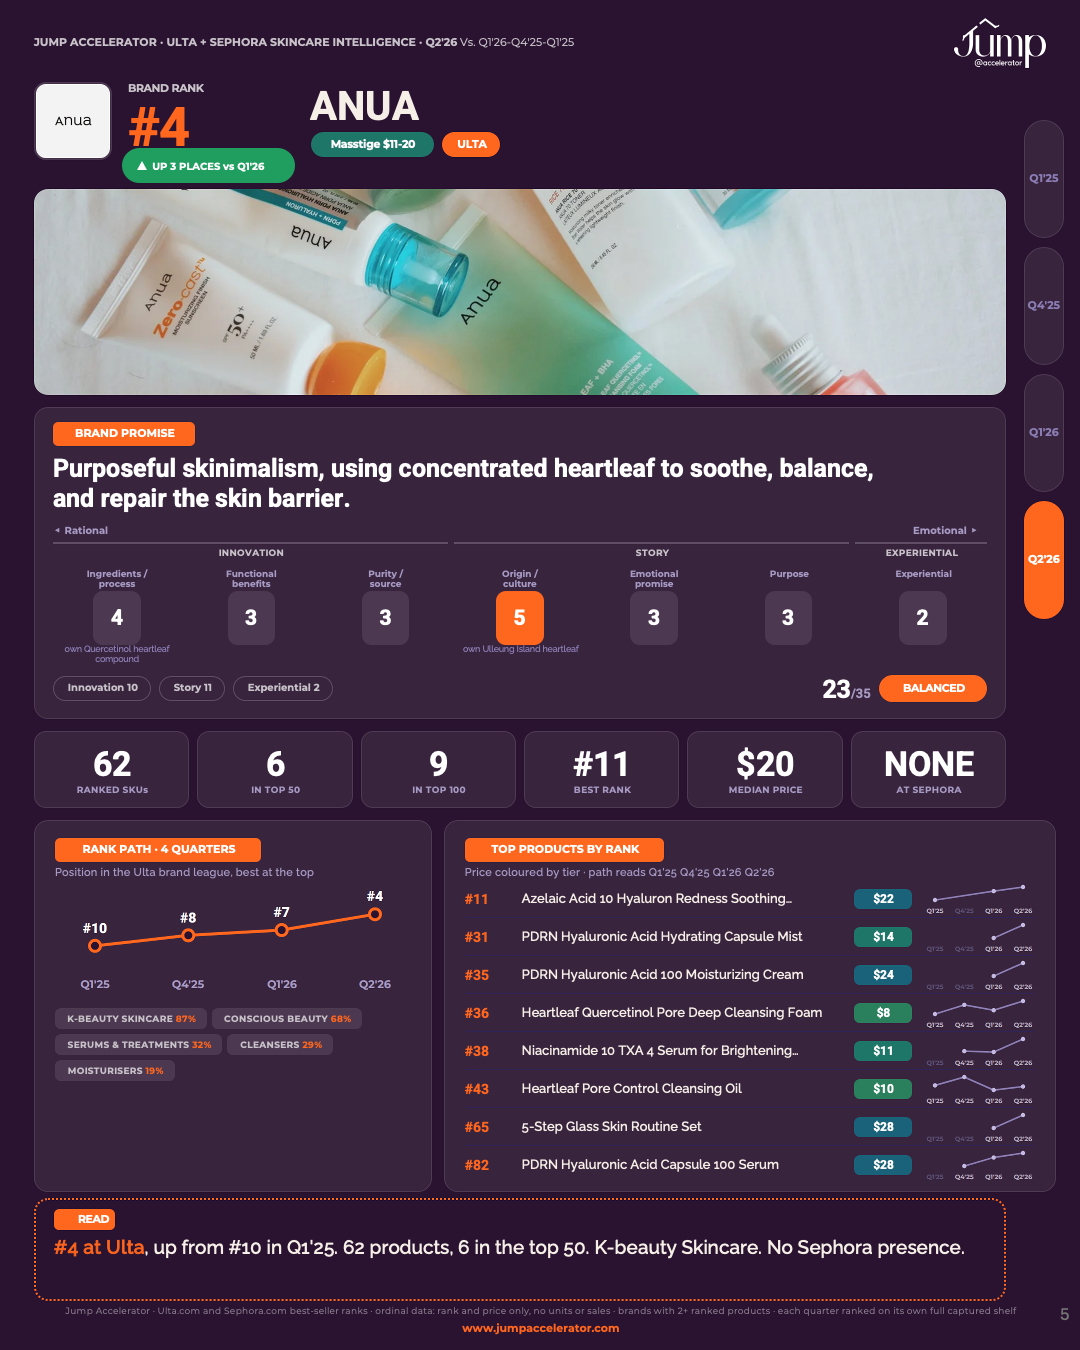
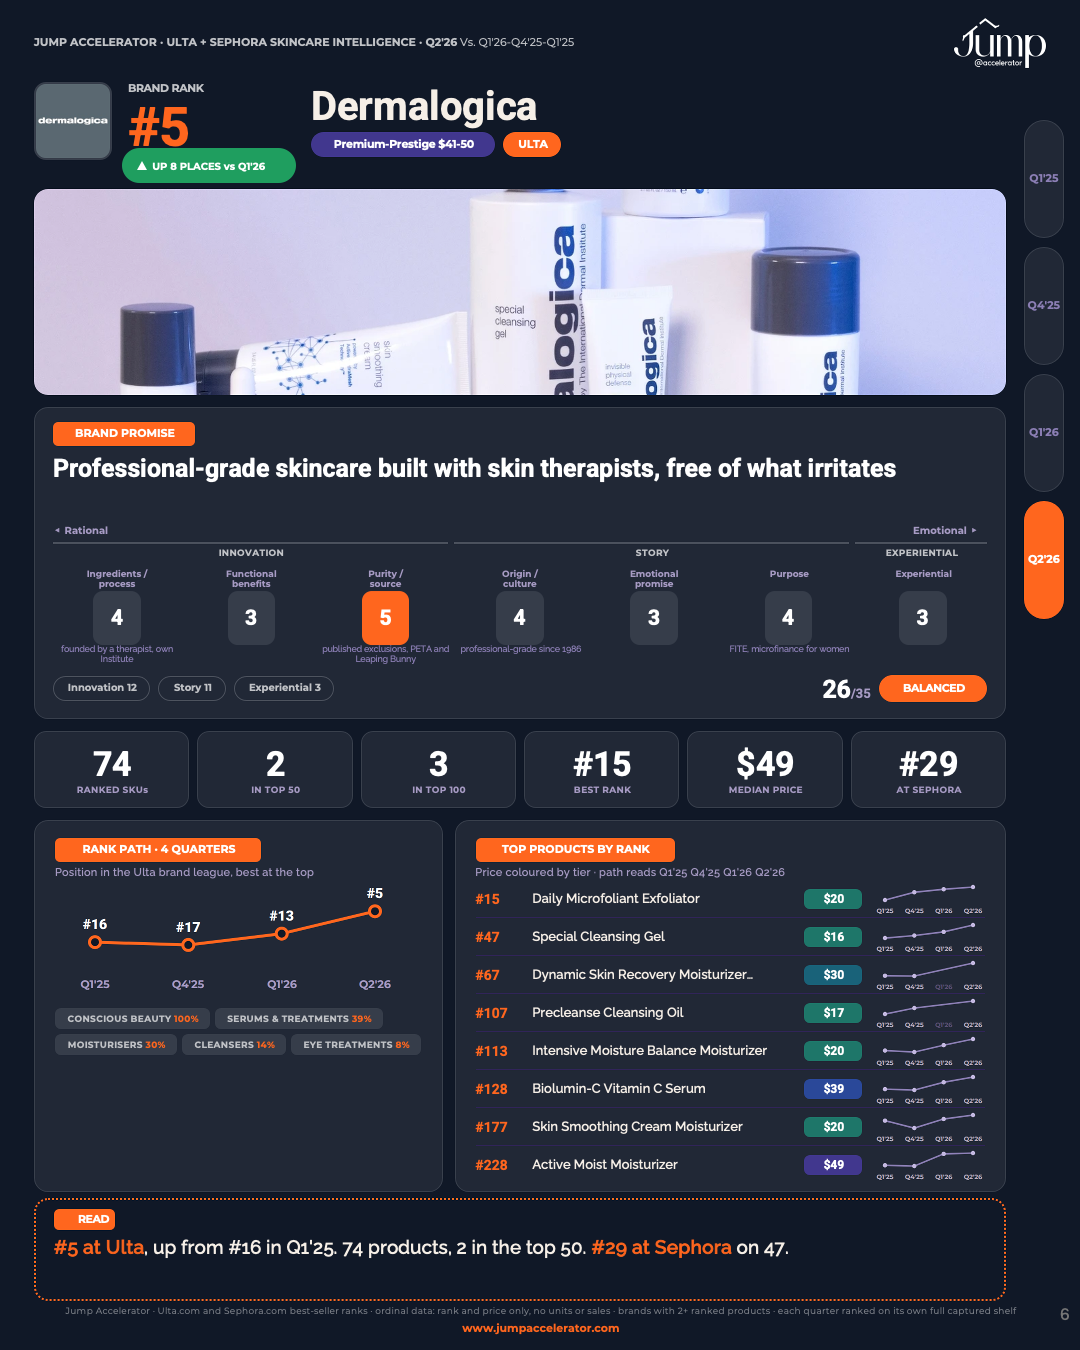
- Ten brand one-pagers: rank, trajectory, price tier, ranked footprint, top products, both doors’ ranks and a seven-stopover positioning read
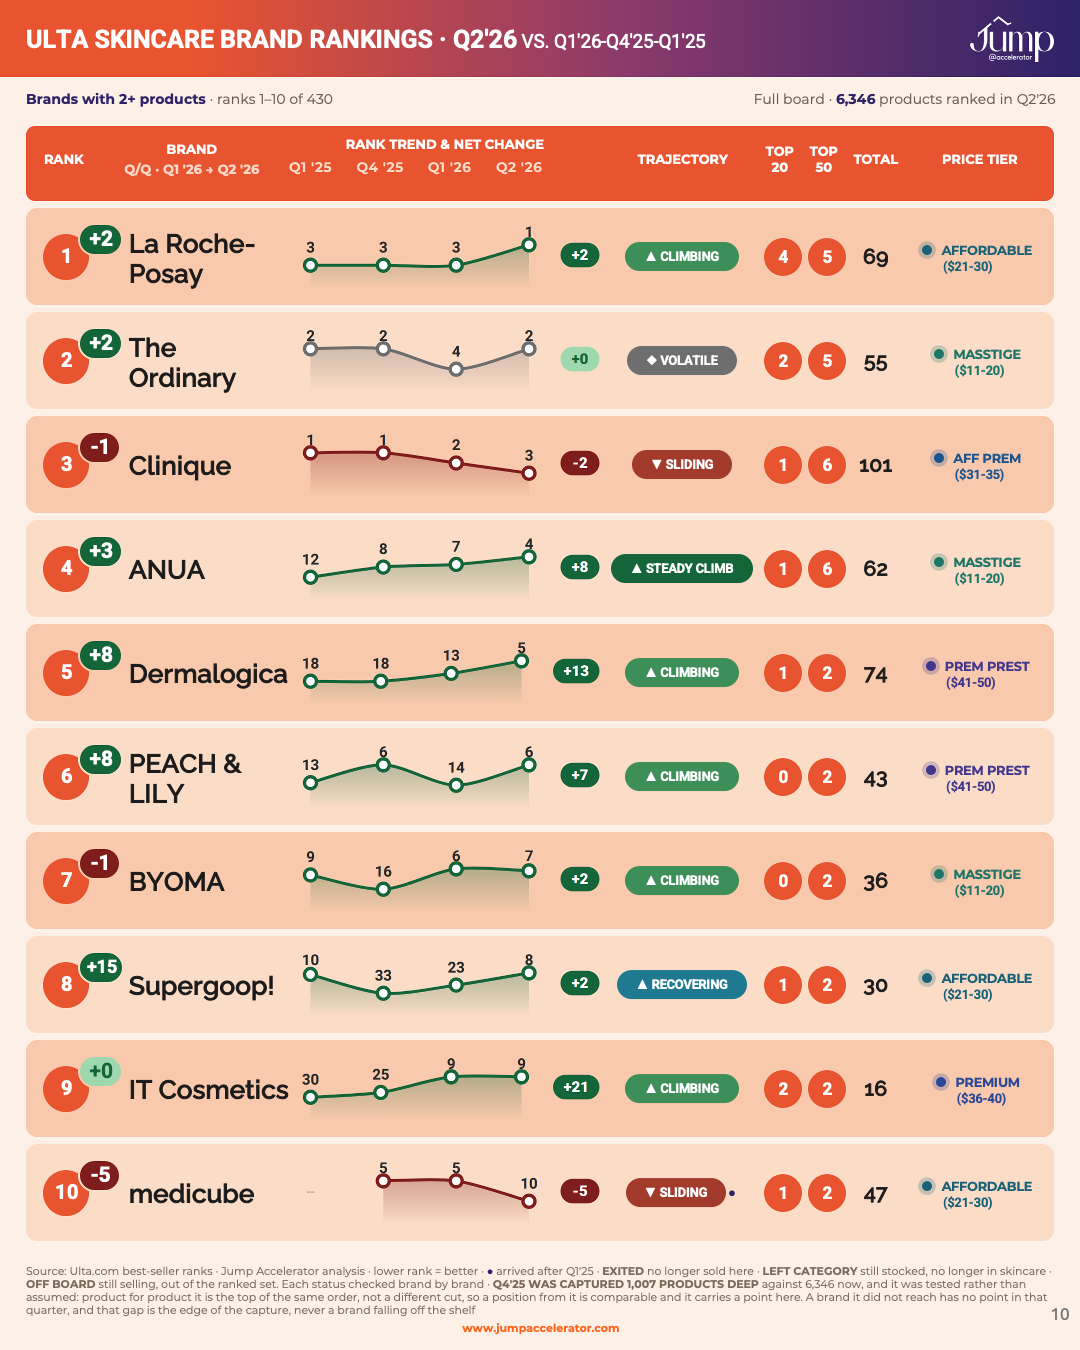
- Brand ranks Q2’26 against Q1’26, Q4’25 and Q1’25 across 21 boards at both doors: 455 brands rank only at Ulta, 133 only at Sephora, 57 at both
- Number of Top 20 and Top 50 products for each brand with its price tier, on every board
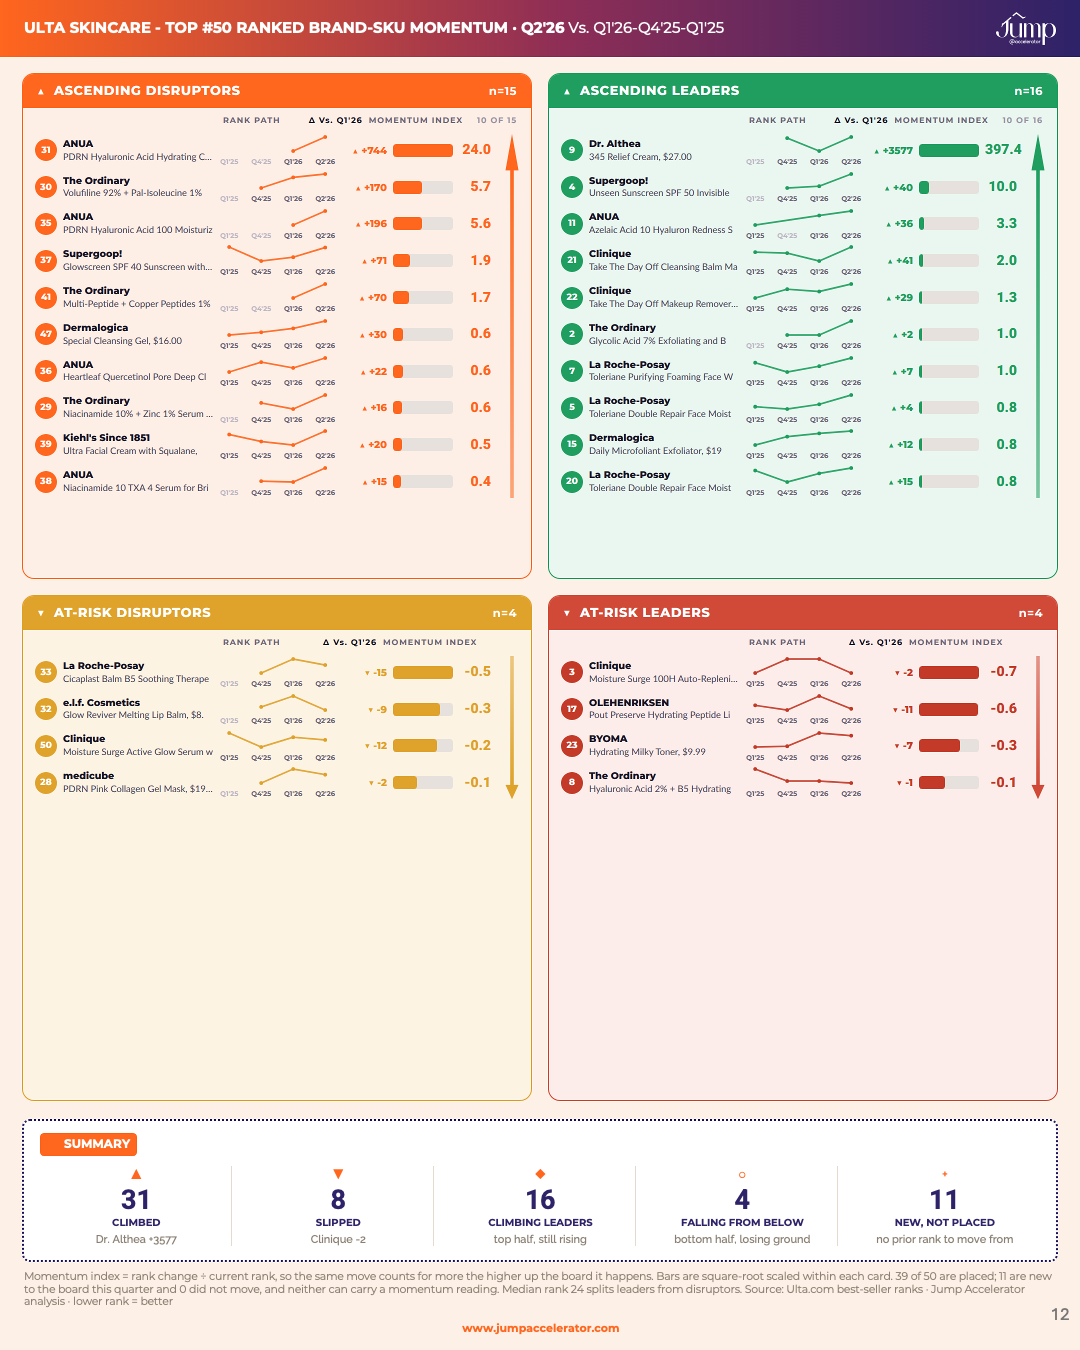
- Top 50 Brand-SKU Rank Changes & Momentum by board: Ascending Leaders, Ascending Disruptors, At-Risk Leaders, At-Risk Disruptors, on full multi-quarter paths
- Three separate leagues on every overall board: formula brands, device and tool houses, single-product brands, so a $795 device is never ranked against a $3 cleanser
- WHO MOVED, every brand named: climbing, peaked, sliding, new and exited, with the full roster in the appendix so no brand is a number
- Category Saturation & Concentration: every tier re-read without its biggest brand, crowding per 10% price step, all 19 category boards side by side
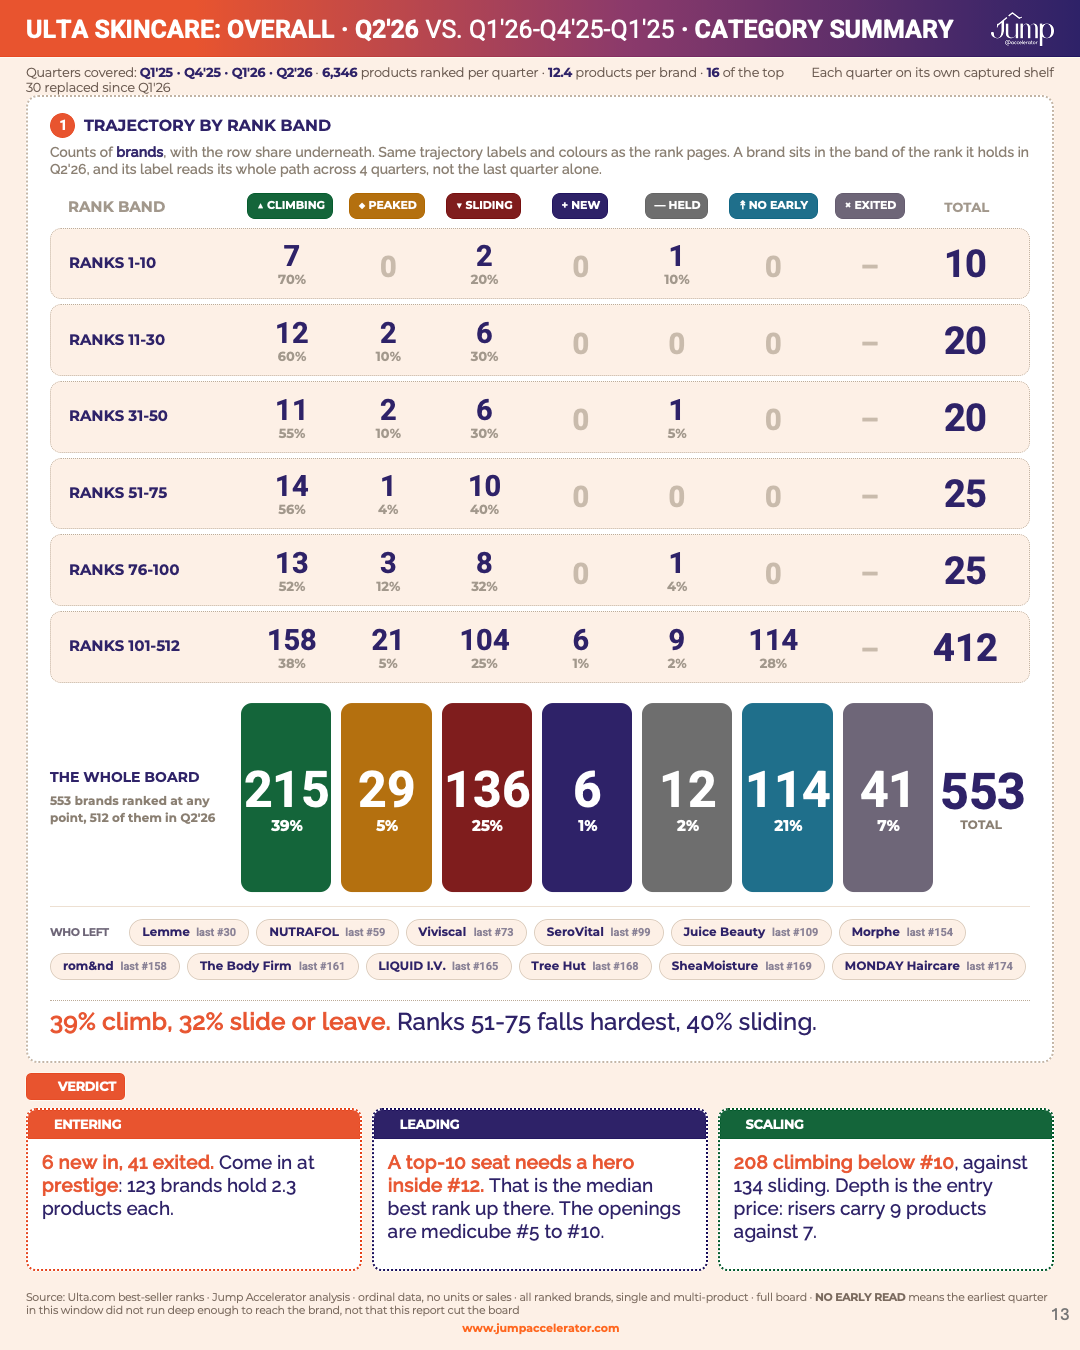
- Category Summary per board: trajectory by rank band, the odds of climbing against sliding, and three computed calls, ENTERING, LEADING, SCALING
8 Skincare Units Fully Analyzed at Ulta, 11 at Sephora:
Overall Skincare, Cleansers, Moisturisers, Serums & Treatments, Treatments, Eye Treatments, Eye Care, Lip Balms & Treatments, Masks, Acne & Blemishes, Anti-Aging, Suncare, Sunscreen, Clean Skincare, Vegan Skincare, Conscious Beauty, K-Beauty Skincare, Skincare Tools.
Access Q2 2026 Vs. Q1 2025-Q4 2025-Q1 2026 Skincare Intelligence Now!
750+ beauty pros trust Jump’s beauty reports.
(Save thousands(>$10K) of dollars in consulting & hundreds of hours in research & analysis)
“Refreshing, pertinent, and deeply insightful. This is the level of competitive intelligence needed to actually understand who is winning & how to win the shelf-war at Ulta and Sephora right now.” Investment Principal | Tier-1 Beauty Corporate Venture Fund

Preview
Preview
Preview
Description
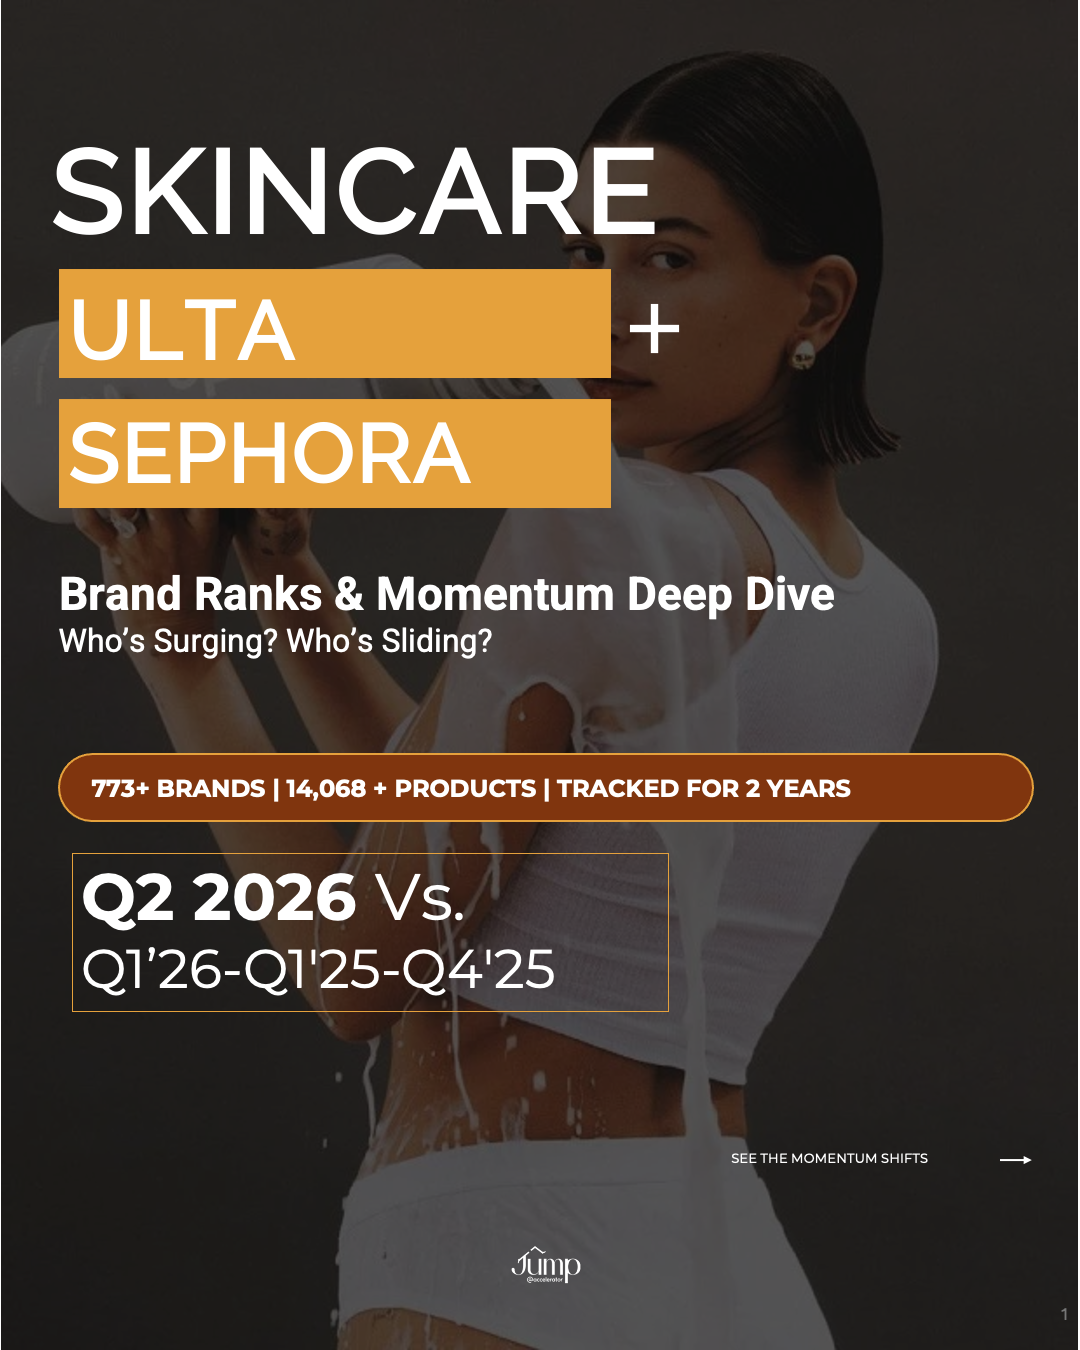
DECODE THE Q2 2026 Vs. Q1’26-Q1’25 SKINCARE: ULTA + SEPHORA BRAND RANKS, MOMENTUM DEEP DIVE. THE COMPETITIVE INTELLIGENCE THAT SEPARATES A LISTING FROM SCALE.
SCALE IN 2026-27.
Who is it for?
Beauty brand founders, CMOs, investors, brand and category marketers, consultants, product developers and retail buyers
Q2 2026 Vs. Q1’26-Q1’25 Skincare Ulta + Sephora USA in 300+ slides: 773+ brands, 14,068+ products, 17 categories, 9 price tiers.
Tracked over 2 years!
Every block reads three ways: Entering a field, Scaling in one, Leading one.
📊 See The Complete Competitive Picture + Brand and SKU Momentum
Every ranked brand at both doors: multi-quarter path, quarter shift, depth, price tier, and the momentum 2x2s behind each move. 512 brands rank at Ulta, 190 at Sephora.
→ Top Retailer Brands: Spot the incumbent sliding faster than its shelf
→ Growth Retailer Brands: See which SKU carries your rank and which rides the brand
→ Aspirant Brands: Know the depth it takes to clear each rung
🎯 Benchmark On Rank Score, Not Catalogue Size
0.8 times the mean of a brand’s best three positions, plus 0.2 times the best five. Lower is better. Multi-product brands, device houses and single-product brands rank in separate leagues, so depth is never mistaken for strength. 31 device and tool houses sit apart at Ulta, derived from Ulta’s own tools board. Sephora publishes no skincare tools board, so it has none, and that is a finding rather than a gap.
→ Top Retailer Brands: See whether three products carry your rank, or thirty
→ Growth Retailer Brands: A short strong range is not punished for being short
→ Aspirant Brands: Learn the score to beat before widening the catalogue
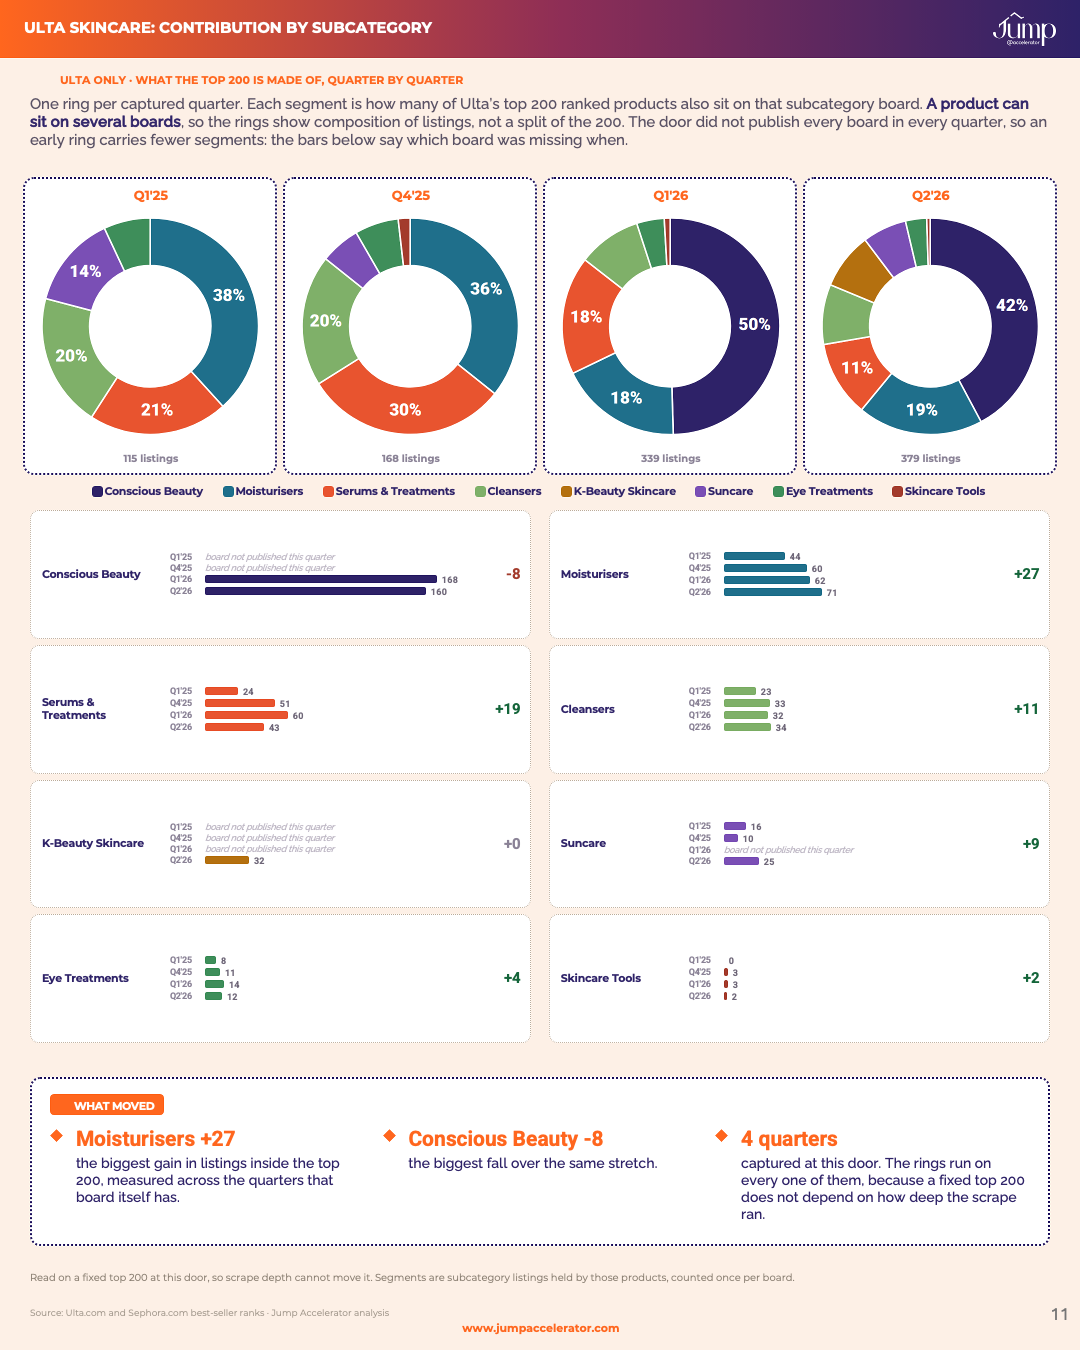
📈 Track Category-by-Category Performance + 19 Category Boards
Ulta’s 8: Cleansers, Moisturisers, Serums & Treatments, Eye Treatments, Conscious Beauty, Suncare, K-Beauty Skincare, Skincare Tools.
Sephora’s 11: Cleansers, Moisturisers, Treatments, Eye Care, Lip Balms & Treatments, Masks, Acne & Blemishes, Anti-Aging, Sunscreen, Clean Skincare, Vegan Skincare.
→ Top Retailer Brands: See where your lead is narrowing
→ Growth Retailer Brands: Find where your rank is weakest against the board’s depth
→ Aspirant Brands: Pick the entry board on evidence, not category size
🚀 Master Price Architecture + What Each Tier Leaves Once Its Leader Is Removed
Nine tiers, priced at each product’s lowest size. Then every band re-read without its biggest brand: shelf per remaining brand, leader share, and crowding per 10% price step.
→ Top Retailer Brands: See which tier you are propping up
→ Growth Retailer Brands: Defend the band where your shelf is thinnest
→ Aspirant Brands: Ulta’s Affordable band runs 391 products per 10% step against 25 at Luxury and 19 at Mass. At Sephora, 249 at Premium against 15 at Luxury and 6 at Mass. Enter where the crowd is thinnest
💡 Top 50 Products, Rank Changes and Momentum by Board
The top 50 SKU ladder at every door and category, priced, tiered and pathed, with the SKU momentum 2×2 behind it. Sephora turns its shelf over faster on 6 of the 6 categories both doors run, widest on Moisturisers at 23 of the top 30 products replaced per quarter against Ulta’s 17.
→ Top Retailer Brands: Compare your hero against the products above it
→ Growth Retailer Brands: Find the SKU doing the work and the one diluting it
→ Aspirant Brands: Study the price points that keep ranking, not the ones that spike
🏆 Climbers, Peakers and Decliners by Rank Band
Every ranked brand grouped by the direction it travelled: climbing, peaked, sliding, new, exited, read band by band, with the odds attached and every brand named.
→ Top Retailer Brands: Watch the band under you fill up
→ Growth Retailer Brands: Ulta runs 215 brands climbing against 136 sliding on its overall board. Sephora runs 54 climbing against 80 sliding and 30 peaked
→ Aspirant Brands:Aim at the band actually turning over. 24 brands were new at Sephora this quarter against 6 at Ulta
🚀 The Two-Door Read + Where Ulta and Sephora Disagree
Brand divergence and SKU movement across both addresses: who ranks at one door only, and who moves opposite ways at the same time. Of 293 products ranked at both doors in both quarters, 154 moved in opposite directions.
→ Top Retailer Brands: Catch the door slipping while the other holds
→ Growth Retailer Brands: Sephora’s ten deepest brands hold 19% of its board against 10% at Ulta, so the same slot costs more to take and more to keep
→ Aspirant Brands: Choose the door your price and depth already fit. 688 products rank at both, out of 14,058
💡 Brand One-Pagers + Positioning On Seven Stopovers
Ten one-pagers carrying rank, trajectory, tier, footprint, the other door’s rank and a 1 to 5 read on ingredients, functional benefits, purity, origin, emotional promise, purpose and experiential. Scored on owned copy, at house level, in skincare only, with evidence behind every 4 and 5.
→ Top Retailer Brands: See where your centre of gravity has drifted
→ Growth Retailer Brands: Read the leaders’ promise against yours, stopover by stopover
→ Aspirant Brands: Take an angle no incumbent at your price owns
🧭 Verdicts & Entry Lanes: 19 Category Boards
→ Category Summary: Three computed calls per board, one line each: ENTERING, LEADING, SCALING. Each names the brand or band it points at, so no advice prints twice
→ Entry Lanes: An entry band, a target rank and the nearest riser to benchmark, ready for a quarter plan. Ulta’s largest structural opening is Moisturisers, 397 brands averaging 4.8 ranked products each; Sephora’s is the same board at 129 brands and 5.0
How do We Collect Data?
Our Market Dominance Index methodology prevents data distortion by weighting sustained performance over viral moments. Stop making category decisions based on gut instinct and incomplete data. Start dominating with the complete competitive picture
(Save tens of thousands of dollars in consulting and hundreds of hours in research and analysis.)
750+ Beauty PROs trust Jump Reports.
Access the Q2 2026 Ulta + Sephora USA Skincare Intelligence Report now!
Related products
-
 Jump Market: Omni-Channel Retail & Funds
Q2 2026 Fragrance: Ulta + Sephora Brand Ranks, Momentum & Competitive Intelligence Vs. Q1’26-Q1’25
$399.00 Add to cart -
 Jump Market: Omni-Channel Retail & Funds
Q2 2026 Haircare: Ulta + Sephora Brand Ranks, Momentum & Competitive Intelligence Vs. Q1’26-Q1’25
$399.00 Add to cart -
 Jump Market: Omni-Channel Retail & Funds
Q2 2026: TikTok Shop USA Fragrance Intelligence Report
$399.00 Add to cart